I am going to share with you what I am seeing in the markets and what I believe will happen. It doesn’t mean that it will, just that it could, and I am going to show you what I am seeing currently.
Before I get to the technicals and some examples, I want to look at some of the recent price action.
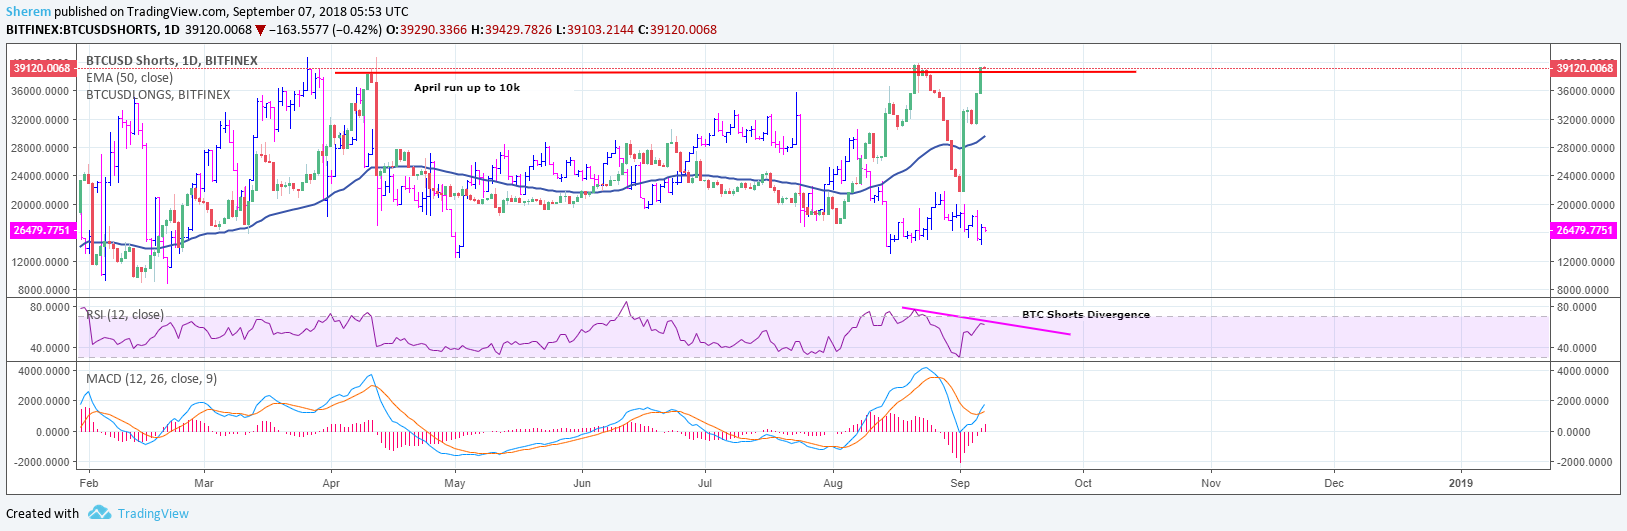
Why the massive spike down?
Answer: A massive influx in BTC shorts.
Notice on this chart that longs hardly dumped.
We also have a massive divergence in short positions.
Now what’s interesting is this short position was taken just before Goldman Sachs said they weren’t going to have a BTC trading desk. But that’s bunk. They bought Poloniex via The Circle! Goldman Sachs saying that is pure unadulterated FUD. They own a crypto exchange. How can they not be trading it?
Is ShapeShift requiring identification concerning?
Answer: IMO, no. Any major exchange you go on requires this. ShapeShift doing this was just an eventuality with how big they have gotten. This isn’t surprising and shouldn’t be to anyone. Disappointing, maybe. But not surprising.
On to a recent example.
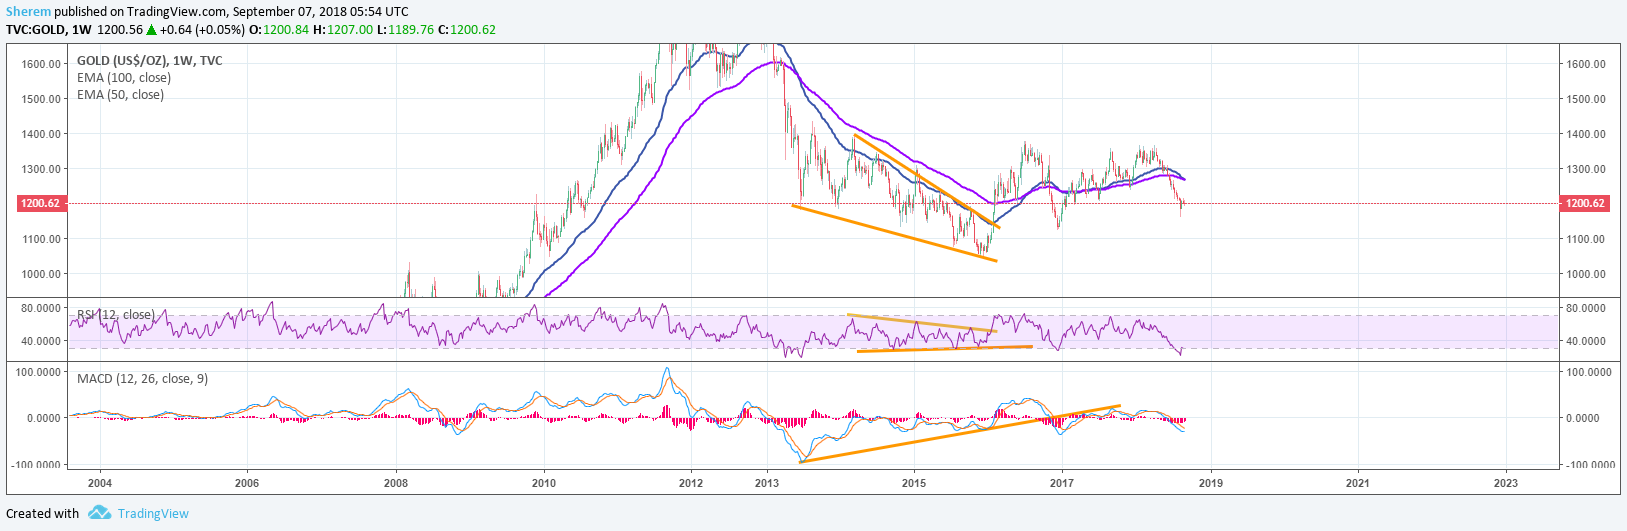
I wanted to pull an example of what to look for and found gold did something very similar in recent times.
Obviously, this chart is much longer in time. But gold is very similar to BTC, is the way people view it, and I think this example is comparable. Key things to notice: the MACD on BTC and gold looks really close to one another. The weekly MACD almost looks about to cross, and the daily has slowly been moving up. However, we had hidden bearish divergence on the daily which caused the drop from 8K, and RSI has been slowly moving up in this channel. I suppose you could argue it’s creating an up trendline divergence, but it seems more of an upward sloping channel.
[the_ad id="42537"] [the_ad id="42536"]It’s not quite a falling wedge, but it’s really close to one. One thing is for certain, instead of testing the 5.7K level, BTC got scooped up at 6.1K again, creating a shift in the channels as outlined in the chart above.
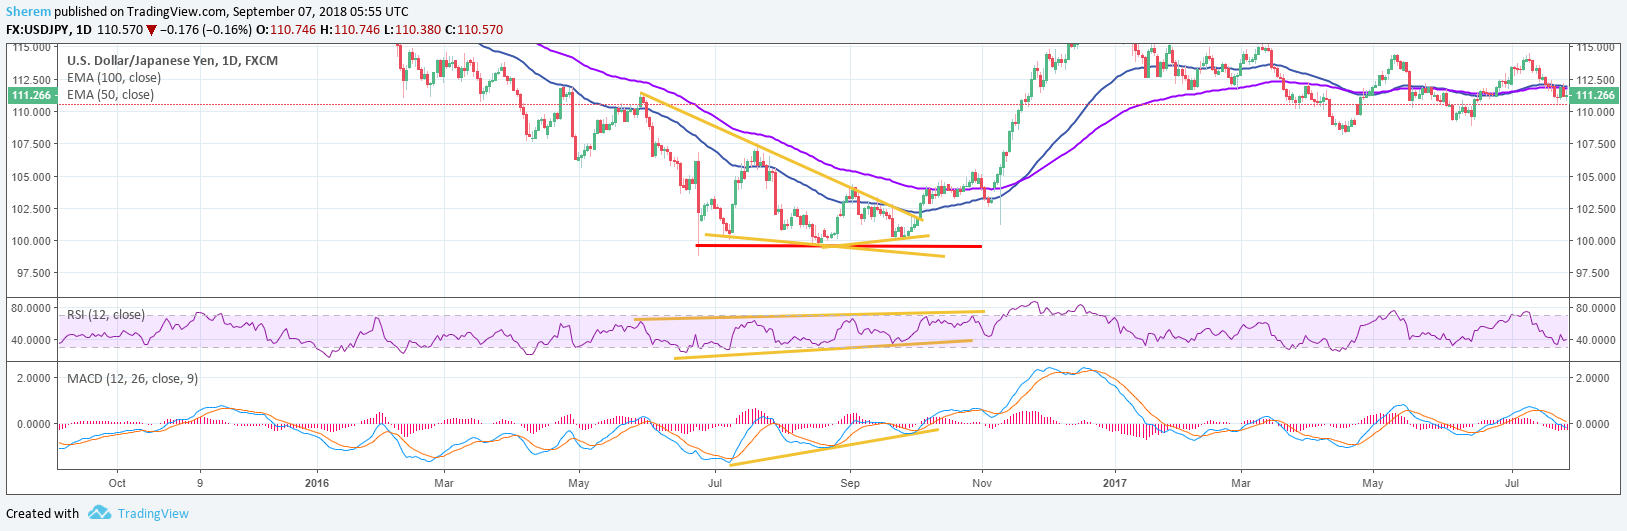
Here is another solid example that is really similar to what’s going on right now.
USD/JPY in 2016. I really like this example. This pair had a massive run up prior to this wedge type pattern forming. Look how similar they are in patterns. Notice the channel shift before the next run up. The gradual rise in RSI that’s not necessarily divergence and what MACD is doing.
Fundamentally we have tons of firms fighting to be the first ETF, new innovations coming out, CBOE saying they are doing Ether futures, etc, etc.
I am in hold mode now. I am bullish. I am long from BTC 6.5K. Long from ETH at an average price around 320. Long from LTC at 60, etc, etc.
Follow Us on Twitter Facebook Telegram