Summary
In the January 2019 edition of our monthly volatility report, the SFOX research team has collected price, volume, and volatility data from eight major exchanges and liquidity providers to analyze the global performance of four leading crypto assets – BTC, ETH, BCH, and LTC.
The following is a report and analysis of their volatility, price correlations, and further development in the previous month.
(For more information on data sources and methodology, please consult the appendix at the end of the report.)
The Current State of Crypto: Crypto Outlook and Correlations in January 2019
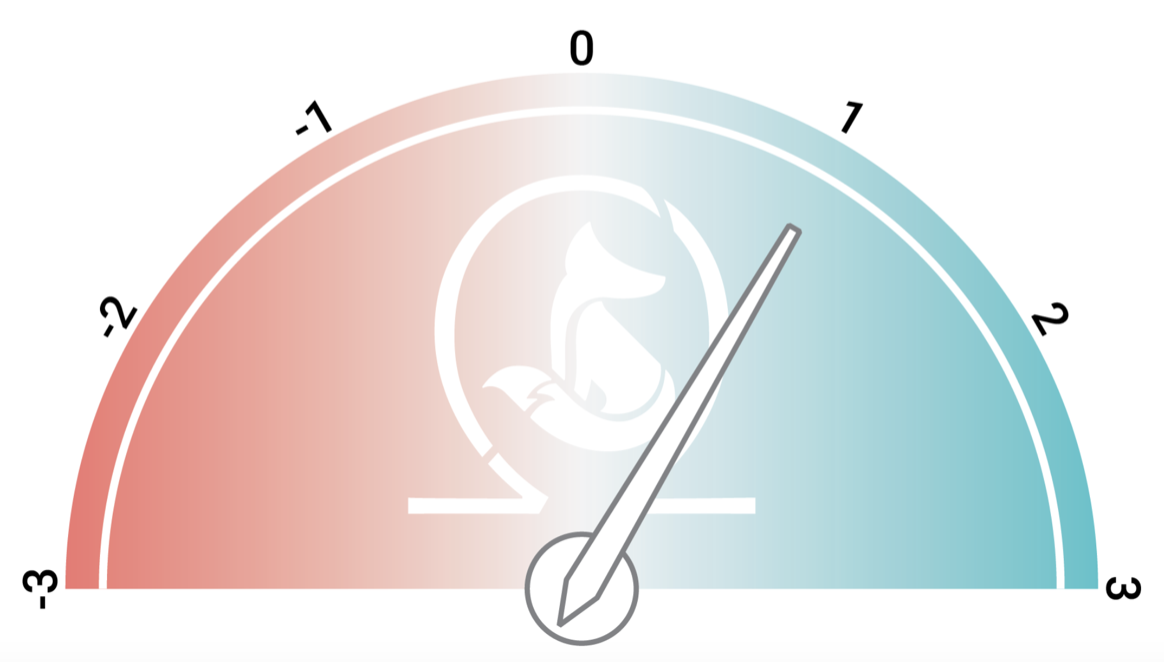
Based on our calculations and analyses, the SFOX Multi-Factor Market Index, which was set at moderately bearish going into 2019, is now set at mildly bullish as we enter February 2019.
We determine the monthly value of this index by using proprietary, quantifiable indicators to analyze three market factors: volatility, market sentiment, and continued advancement of the sector. The index ranges from highly bearish to highly bullish.
Volatility in leading crypto assets decreased throughout the month of January following the late-2018 run-up in volatility. In terms of market sentiment, we’re seeing a combination of less public attention on crypto “hype” – e.g., headlines, a 24-hour crypto news cycle, and ICOs – and sustained institutional interest in crypto exposure. We’re also seeing a compelling combination of (1) teams and institutions working on blockchain use cases and (2) increased usage of blockchain networks themselves.
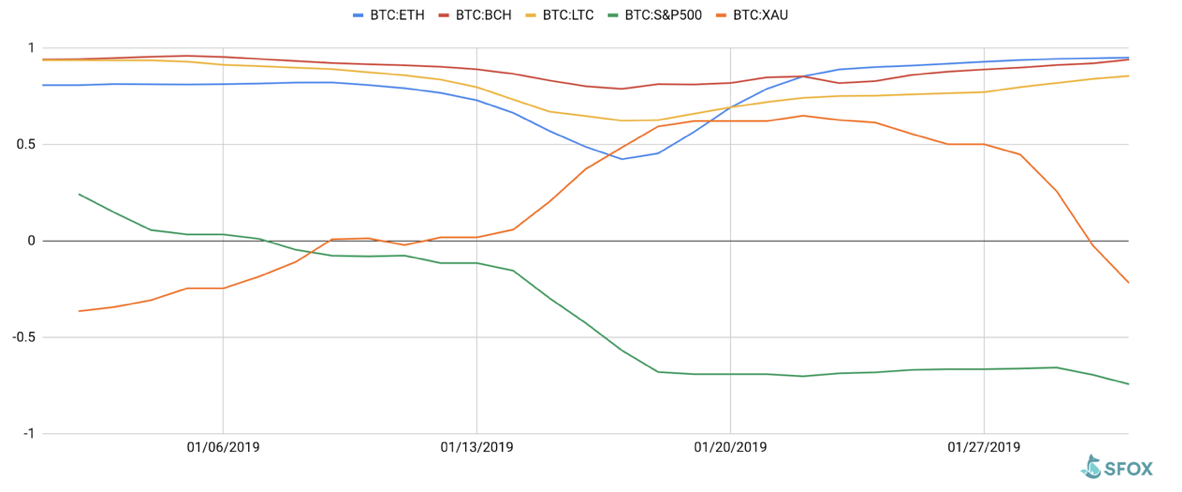
BTC’s 30-day price correlations to ETH, BCH, and LTC closed the month as very positive (i.e. close to a value of 1), though BTC was less correlated to LTC than it was to ETH and BCH. Of the crypto assets on SFOX, LTC and BCH were the least correlated, ending the month with a 30-day correlation value of 0.699 (still fairly positive). ETH and the S&P 500 were the most negatively correlated assets at -0.831, and the asset pair showing the least correlation (i.e. close to a value of 0) is BCH and gold at 0.079.
For a full crypto correlations matrix, see the following chart.
A graph of those 30-day correlations over the past month shows that there has been a significant amount of fluctuation in BTC’s correlations to the S&P 500 and gold over the last month.
On the other hand, BTC’s correlations to ETH, BCH, and LTC were fairly stable throughout the month, with the exception of a dip in correlation values on the 17th.
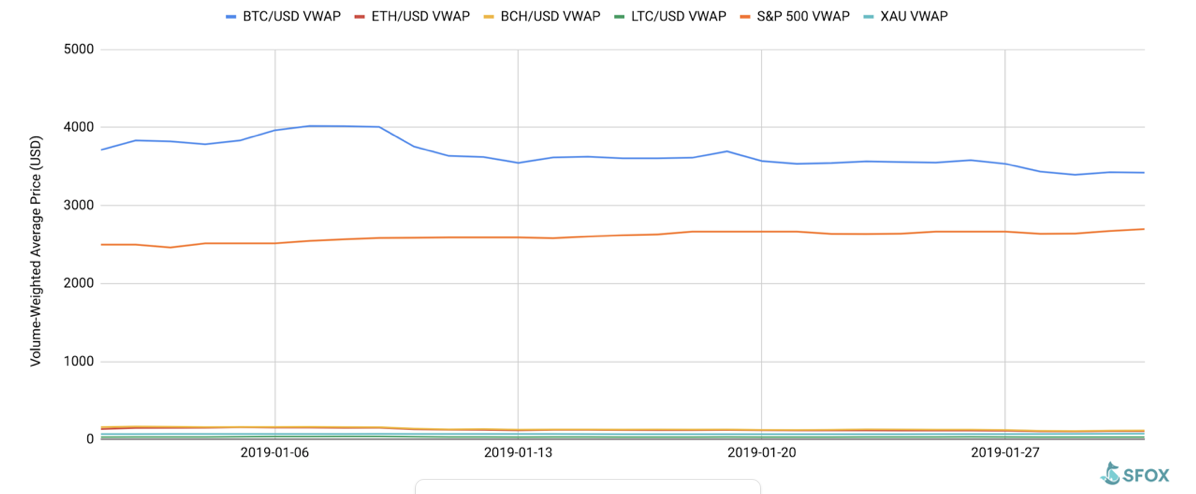
January Overview: A Settling Wave
After an uptick in marketwide crypto volatility at the end of last year, January saw prices stabilize somewhat – BTC, for instance, ranged between $3,500 and $3,700 for over half the month.
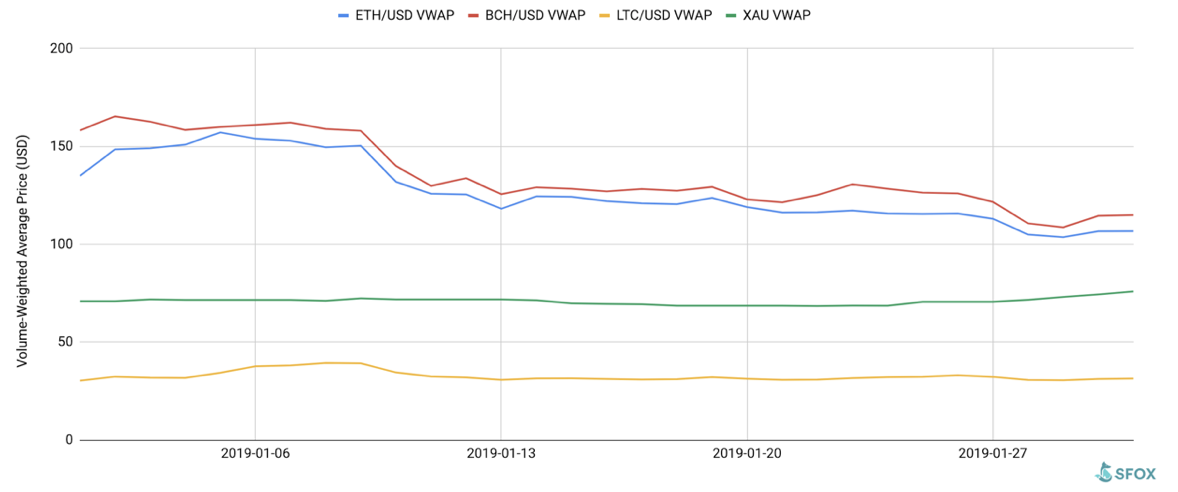
For greater graphical clarity, see this additional chart omitting BTC and the S&P 500 from the data set.
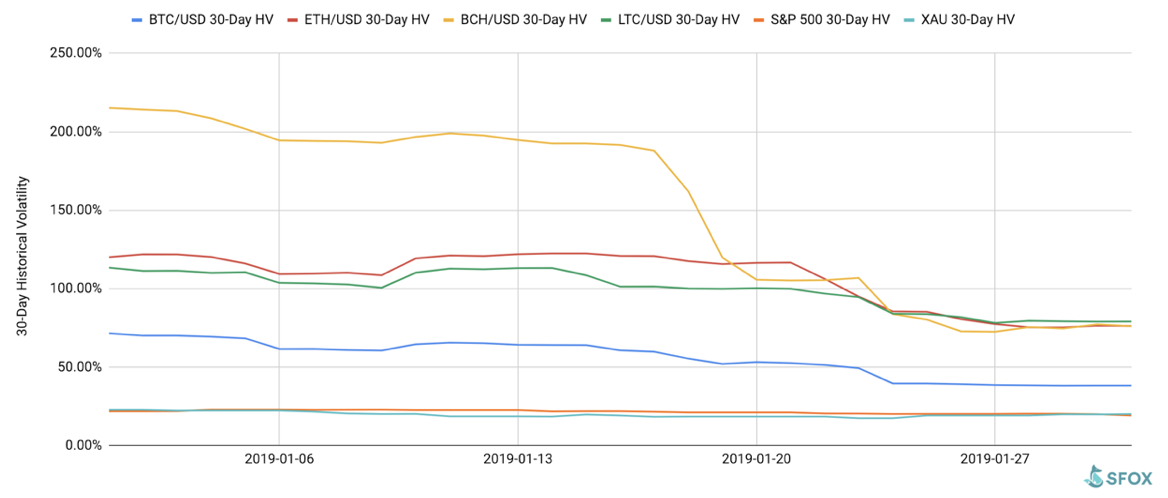
We can see the stabilizing of crypto prices in action by looking at the 30-day historical volatilities of BTC, ETH, BCH, and LTC, all of which decreased from the start of the new year to the end of January.
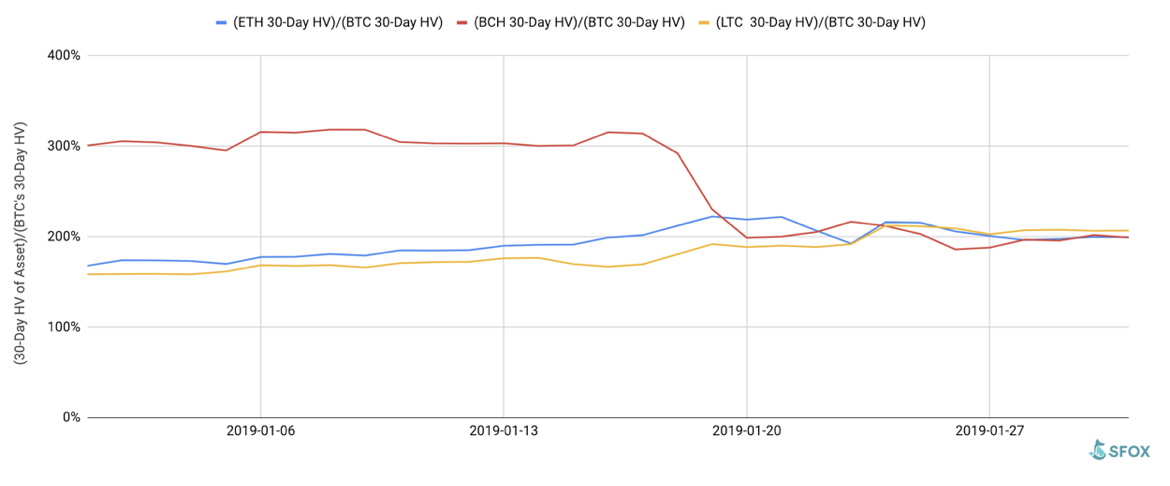
If we look at the 30-day historical volatilities of ETH, BCH, and LTC as a percentage of BTC’s 30-day historical volatility, we see that ETH and LTC’s movements were in line with BTC’s – that’s what the fairly horizontal slope of those lines tell us. BCH, in contrast, experienced a sharp drop in its BTC-volatility-relative volatility from the 18th to the 20th – from 300% to 200%, bringing it in line with the BTC-volatility-relative volatilities of ETH and LTC.
Two things stand out in this month’s data on crypto volatility: (1) the sharp decrease in BCH’s volatility and (2) the general marketwide decrease in crypto volatility.
BCH’s decrease in volatility may signal that the conflict between BCH and BSV is subsiding. As we discussed in our year-end 2018 volatility report, BCH’s volatility initially spiked in November in anticipation of the November hard fork that created BSV – and that volatility only continued during the hash war that followed the fork. More recently, however, the BCH and BSV camps appear to have carved out a reasonably peaceful coexistence, focusing more on continuing to develop their own projects rather than attacking each other. From lessened uncertainty and lessened speculation – on both sides of the aisle – comes decreased volatility.
The overall decrease in crypto volatility may reflect the industry’s current “building phase.” With less hype and fewer major headlines in the past month, the focus has instead been on strong, dedicated teams building actually useful products and services. This redirection of attention to product development rather than avid market-watching could ultimately prove to not just correspond to lower volatility, but also make the crypto ecosystem generally healthier.
What to Watch in February 2019
Look to these events as potentially moving the volatility indices of BTC, ETH, BCH, and LTC in the coming month.
Appendix: Data Sources, Definitions, and Methodology
We use two different in-house volatility indices in creating these reports.
1. 30-day historical volatility (HV) indices are calculated from daily snapshots over the relevant 30-day period using the formula:
30-Day HV Index = ?(Ln(P1/P0), Ln(P2/P1), …, Ln(P30/P29)) * ?(365)
2. Daily historical volatility (HV) indices are calculated from 1440 snapshots over the relevant 24-hour period using the formula:
Daily HV Index = ?(Ln(P1/P0), Ln(P2/P1), …, Ln(P1440/P1439))* ?(1440)
S&P 500 and XAU data are collected from Yahoo! Finance.
The SFOX Multi-Factor Market Index is calculated using a proprietary formula that combines quantified data on search traffic, blockchain transactions, and crypto volatility.
The crypto asset data sources aggregated for the volatility indices presented and analyzed in this report are the following eight exchanges, the order-book data of which we collect and store in real time:
Our indice’s integration of data from multiple top liquidity providers provide a more holistic view of the crypto market’s minute-to-minute movement. There are two problems with looking to any single liquidity provider for marketwide data.
Building volatility indices that collect real-time data from many distinct liquidity providers mitigates both of these problems: collecting and averaging data from different sources prevents any single source from having an outsized impact on our view of the market, and it also allows us to still have data for analysis even if one or two of those sources experience interruptions. We use five redundant data collection mechanisms for each exchange in order to ensure that our data collection will remain uninterrupted even in the event of multiple failures.
Presently, we anticipate that data on Ethereum Classic (ETC) will be in the volatility report starting next month (the February 2019 edition), and data on Bitcoin SV (BSV) will be added to the report in the following month (the March 2019 edition).
Report compiled by the SFOX Research Team, which provides holistic analyses of the crypto market geared towards sophisticated traders and institutional investors. They originally published this report on the SFOX blog here.
Follow Us on Twitter Facebook Telegram