Summary
In the March 2019 edition of our monthly volatility report, the SFOX research team has collected price, volume, and volatility data from eight major exchanges and liquidity providers to analyze the global performance of 6 leading crypto assets? – BTC, ETH, BCH, LTC, BSV, and ETC.
The following is a report and analysis of their volatility, price correlations, and further development in the last month. (For more information on data sources and methodology, please consult the appendix at the end of the report.)
Readers should note that, in the spirit of analyzing consistent time-frames and viewing data in the context of long-term trends, this report neither includes nor analyzes the sharp increase in crypto volatility that we have witnessed in the beginning of April. That volatility will be presented and analyzed in the April 2019 Volatility Report this coming month.
Current Crypto Market Outlook: Mildly Bullish
Based on our calculations and analyses, the SFOX Multi-Factor Market Index, which was set at ‘mildly bullish’ at the end of February 2019, remains at ‘mildly bullish’ at the end of March? – ?although the index is now edging further in the bullish direction.
We determine the monthly value of this index by using proprietary, quantifiable indicators to analyze three market factors: price momentum, market sentiment, and continued advancement of the sector. It is calculated using a proprietary formula that combines quantified data on search traffic, blockchain transactions, and moving averages. The index ranges from highly bearish to highly bullish.
Even ahead of the bullish surge that the crypto market has witnessed in the first days of April, March showed mildly bullish sentiment towards the sector? – ?sentiment which has been gradually increasing month-over-month since we launched the index late last year.
While some outlets such as The Wall Street Journal expressed bearish sentiment about the state of the market, several major coins showed significant growth in transaction volume, and companies such as Visa and Facebook expressed sustained interest in crypto and blockchain technologies. The data suggest that growth is still happening where it counts, as institutions continue to be interested in crypto and the sector’s infrastructure continues to mature.
Analysis of March 2019 Crypto Volatility
In March of 2019, individual altcoins saw a mixture of apparently motivated and unmotivated moves in volatility, set against the backdrop of an overall industry becoming less volatile and more mature.
LTC’s price increase and volatility seemed to level off after months of growth (March 10th-31st)
Last month, SFOX highlighted five factors that may have been contributing to LTC’s price nearly doubling since the beginning of 2019: increased adoption, lower fees, faster transactions, an exploration of private transactions, and the upcoming halving event. From March 10th through the end of the month, however, LTC’s volatility decreased substantially as its price held between $54.93 USD and $60.46 USD. This may mean that the market is approaching the point at which it’s priced in the Litecoin fundamentals we enumerated in our article.
BCH jumped in price and volatility in the middle of the month with no apparent cause (March 15–16th)
In the middle of the month, BCH’s price jumped 18% in two days. While this spike did roughly correspond with an under-the-radar announcement of features coming in the chain’s hard fork later this year, there didn’t seem to be an obvious explanation for the sudden price hike. During this time, BCH’s trading volume was also led by LBank? – ?an exchange that was recently highlighted in a report of exchanges that may potentially be faking a large portion of their alleged trade volume. It’s possible, therefore, that this March BCH rally may have been one of those spooky “rallies” that wasn’t grounded by anything fundamental.
ETC became gradually more volatile throughout the month
Even as crypto volatility collectively decreased, ETC’s BTC-relative 30-day historical volatility (defined below as a measure of a crypto asset’s volatility relative to the broader crypto market) gradually increased throughout the month, starting at 146% and ending at 205%. This may be a function of increasing uncertainty about the future of this particular blockchain: on the one hand, ETCLabs’ renewed focus on Dapp development (especially Dapps focused on the Internet of Things) has some believing that ETC may be currently undervalued platform for powering the next evolution of internet technologies; on the other hand, the still-recent 51% attack on Ethereum Classic, coupled with news about figures such as Anthony Lusardi stepping down from prominent ETC roles, has some worried about the long-term prospects for the community.
Major companies continue to invest in the blockchain and crypto spaces in times of low volatility
The major trend in crypto volatility was downward in March, with BTC falling from 32.68% 30-day historical volatility at the start of the month to 17.94% volatility at the end of the month. At the same time that crypto volatility was decreasing, reports told of major companies like Visa and Facebook investing in crypto technologies. This reinforces the narrative that the industry as a whole is continuing to mature, attracting the attention of more institutions as infrastructure improves.
What to Watch in April 2019
Look to these events as potentially moving the volatility indices of BTC, ETH, BCH, LTC, BSV, and ETC in April:
Market uncertainty following the unexplained price jump of April 1st-2nd
In the first few days of April, the price of BTC has shot from $4089.54 USD to a peak of $5,089.99 USD on the 2nd? – ?a jump of almost 25% in two days, without an immediately apparent fundamentals-based explanation. If the late-2017 rally is any indication, the sharp movement in BTC’s price without a clear cause could potentially lead to greater market uncertainty, which, in theory, could drive volatility upwards.
Multiple high-profile crypto conferences
April features at least four high-profile conferences centered on institutional or professional interest in crypto and blockchain technologies: New York High Tech & Innovation Family Office Meeting (April 10th), Palm Beach Global Finance Form (April 10th), Paris Blockchain Week (April 13th-19th), Blockchain Expo Global, London (April 25th-26th).
Because these conferences are opportunities to educate and generate new interest in the sector, they could potentially drive volatility? – ?especially when targeted towards groups or individuals that control sizable pools of capital.
CME BTC futures last-trade date on April 26th
Crypto volatility typically moves around the time of futures expirations. With CBOE backing off from BTC futures for the time being, the date of CME’s futures expiration may potentially impact volatility more than usual.
The Details: March 2019 Crypto Price, Volatility, and Correlation Data
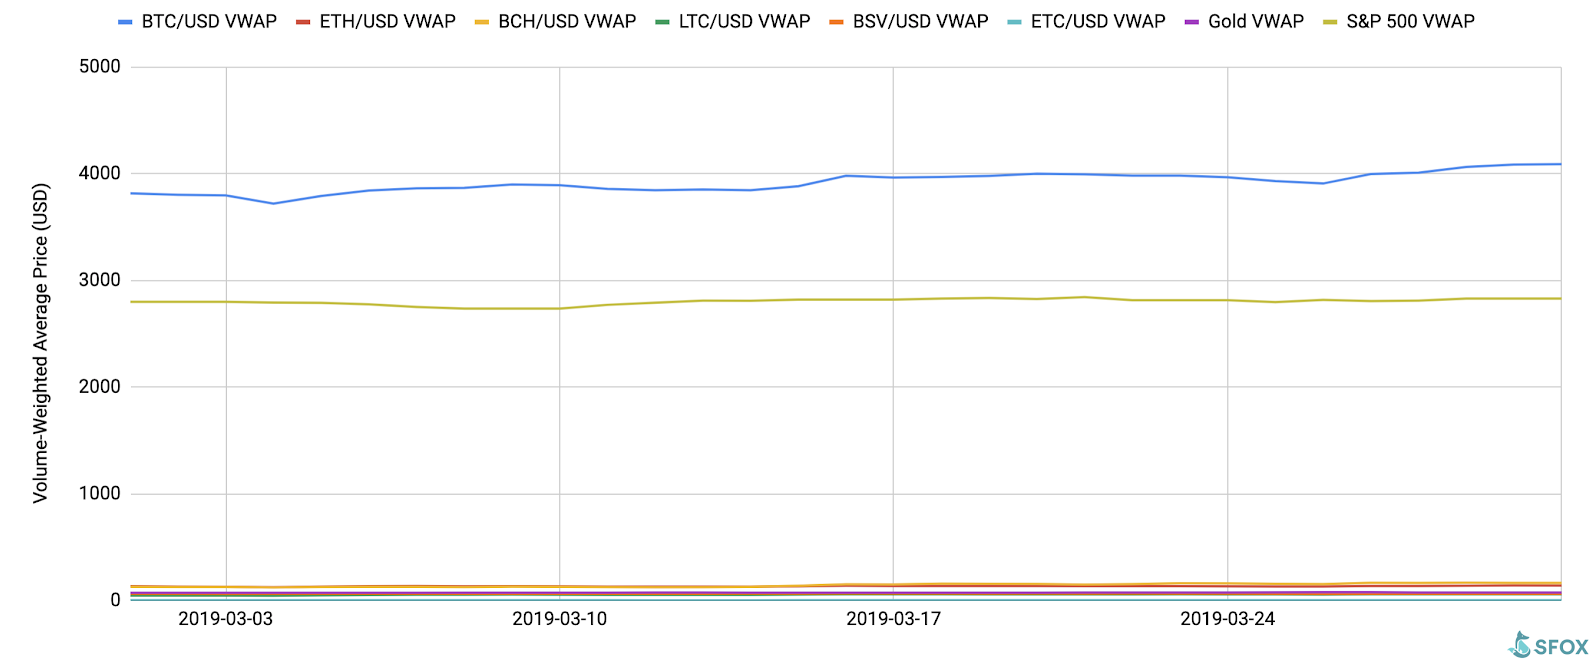
Price Performance
March saw relatively little movement in crypto prices. BTC opened the month at $3816.29 USD before dipping to a low of $3719.67 USD on March 4th; after that, it gradually climbed to a price of $4089.54 USD at the end of the month.
For greater graphical clarity, see this additional chart omitting BTC and the S&P 500 from the data set:
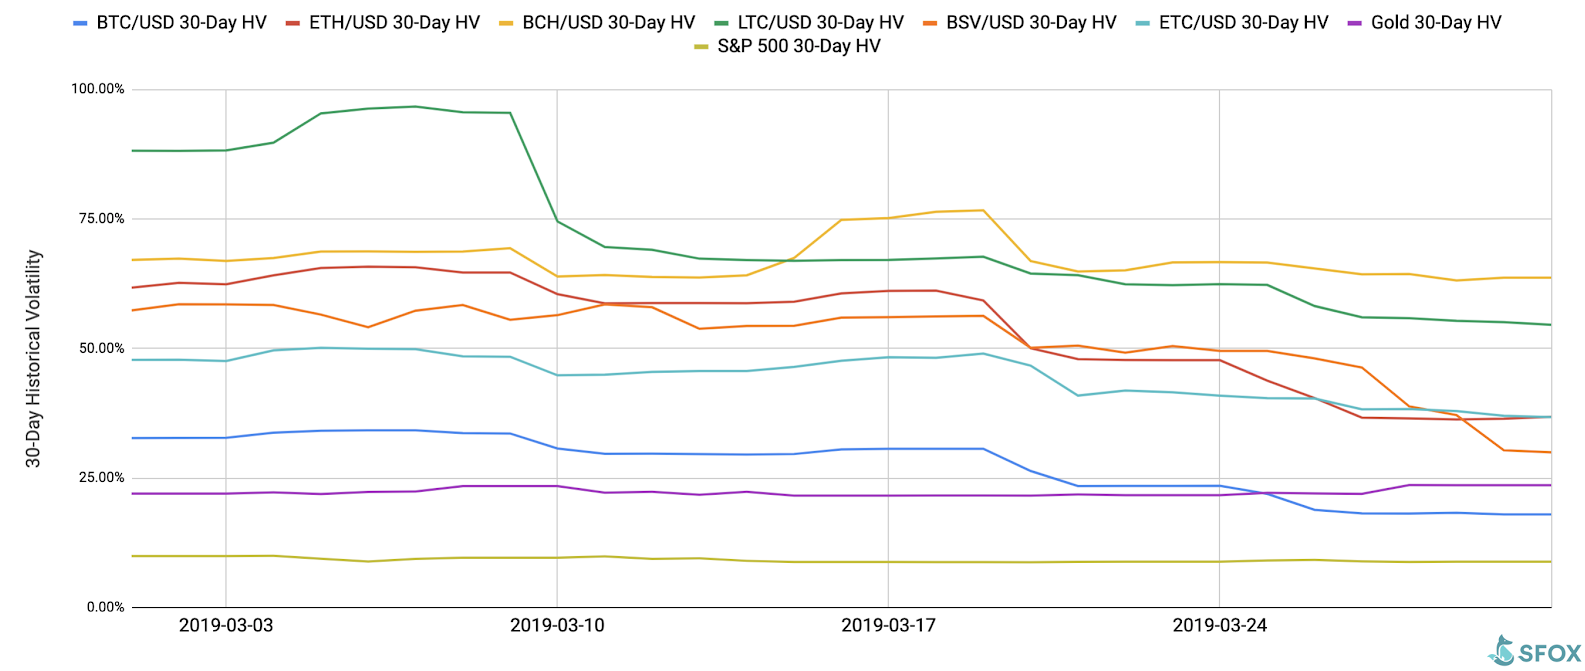
Volatility
By looking at the 30-day historical volatilities of BTC, ETH, BCH, LTC, BSV, and ETC, we see that the crypto sector’s volatility gradually declined throughout the month, with the exception of LTC’s volatility increasing in early March and BCH’s volatility increasing in mid-March.
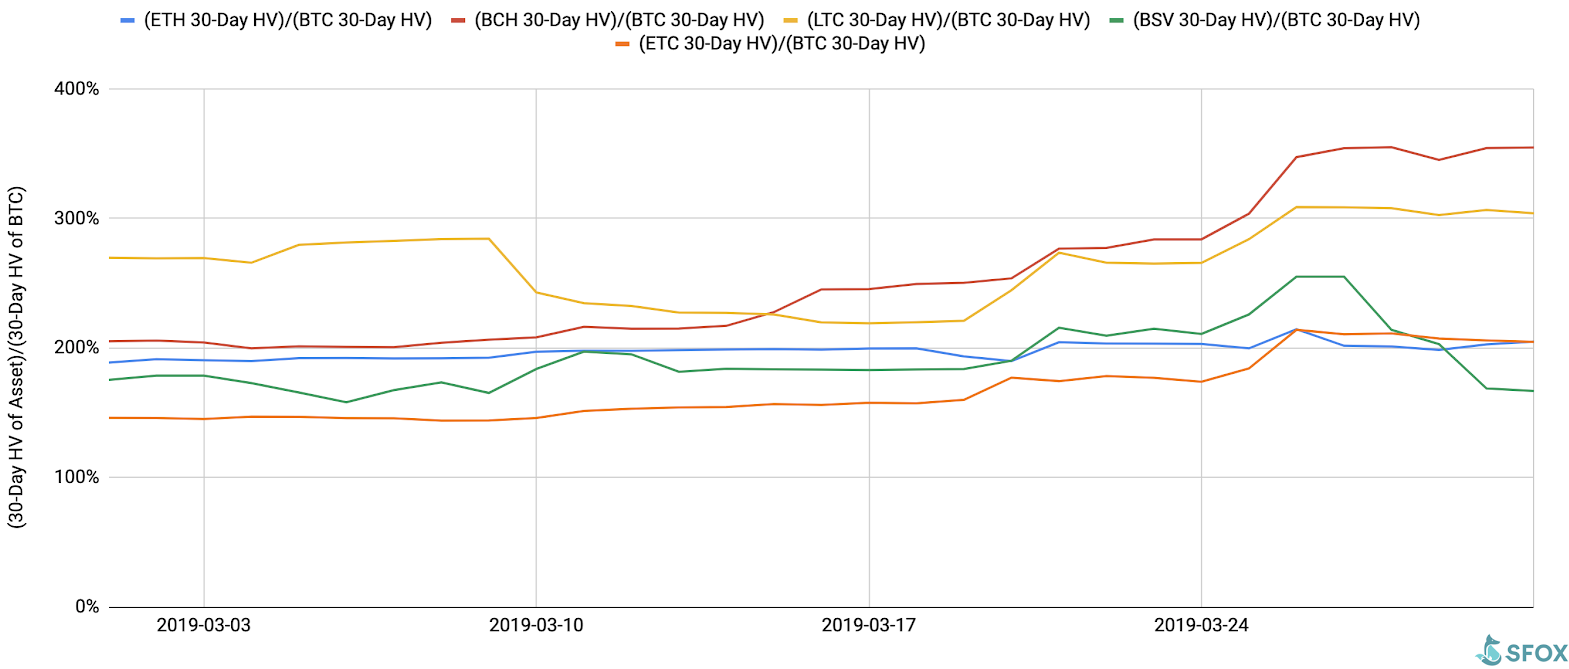
If we look at the 30-day historical volatilities of ETH, BCH, LTC, BSV, and ETC as a percentage of BTC’s 30-day historical volatility, we see that ETH, LTC, and BSV’s movements were, on average, roughly in line with BTC’s? – ?though not as much as they were in February. BCH and ETC, on the other hand, saw their BTC-relative volatilities increase over the course of the month.
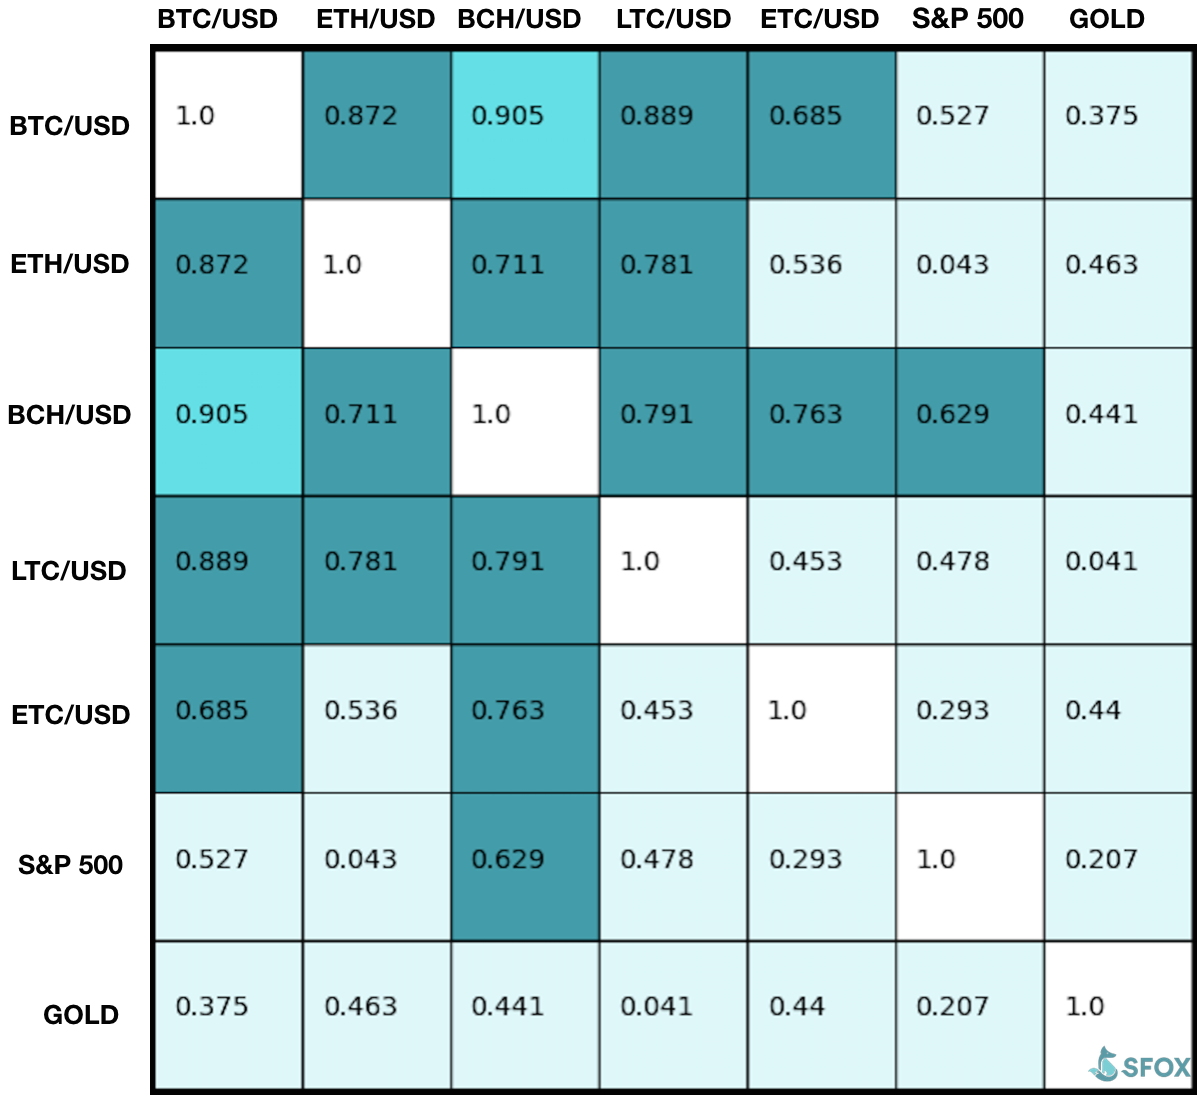
Price Correlations
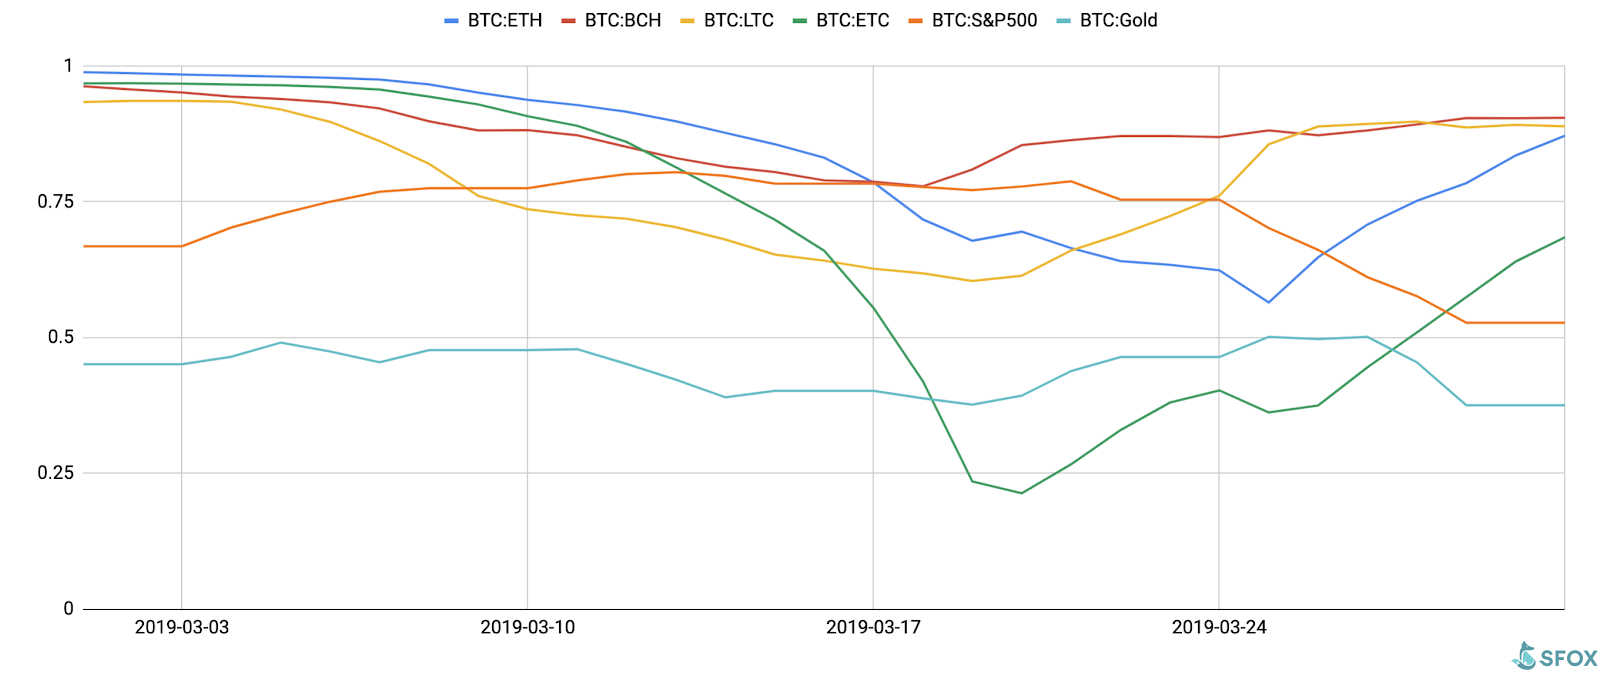
BTC’s 30-day price correlations to ETH, BCH, LTC, and ETC all closed the month as highly positive (i.e. close to 1). The crypto asset least correlated to BTC was ETC, with a correlation of 0.685; the least correlated crypto asset pair was LTC and ETC, with a correlation of 0.453.
For a full crypto correlations matrix, see the following chart:
Notably, the correlation level between BTC and ETC steadily decreased from the beginning of March through March 20th, at which point the two were at a fairly low positive correlation of 0.21. This reinforces our earlier analysis that the uncertainty specifically surrounding ETC may be driving its volatility.
Appendix: Data Sources, Definitions, and Methodology
We use two different in-house volatility indices in creating these reports:
1. 30-day historical volatility (HV) indices are calculated from daily snapshots over the relevant 30-day period using the formula:
30-Day HV Index = ?(Ln(P1/P0), Ln(P2/P1), …, Ln(P30/P29)) * ?(365)
2. Daily historical volatility (HV) indices are calculated from 1440 snapshots over the relevant 24-hour period using the formula:
Daily HV Index = ?(Ln(P1/P0), Ln(P2/P1), …, Ln(P1440/P1439))* ?(1440)
S&P 500 performance data are collected from Yahoo! Finance using GSPC (S&P 500 Index) data. Gold performance data are collected from Yahoo! Finance using XAU (Philadelphia Gold and Silver Index) data.
The crypto asset data sources aggregated for crypto prices, correlations, and volatility indices presented and analyzed in this report are the following eight exchanges, the order-book data of which we collect and store in real time:
Our indices’ integration of data from multiple top liquidity providers offers a more holistic view of the crypto market’s minute-to-minute movement. There are two problems with looking to any single liquidity provider for marketwide data:
Building volatility indices that collect real-time data from many distinct liquidity providers mitigates both of these problems – collecting and averaging data from different sources prevents any single source from having an outsized impact on our view of the market, and it also allows us to still have data for analysis even if one or two of those sources experience interruptions. We use five redundant data collection mechanisms for each exchange in order to ensure that our data collection will remain uninterrupted even in the event of multiple failures.
Report compiled by the SFOX Research Team, which provides holistic analyses of the crypto market geared towards sophisticated traders and institutional investors. This report was originally published on the SFOX blog.
Follow Us on Twitter Facebook Telegram