The price of Bitcoin initially stabilized near the 7,500 level after dipping into the 6,500 area earlier this week. As we wrap up November, where will Bitcoin prices go from here? While altcoins also have shown signs of recovery, what does this mean for the “Alt Season” believers?
Bitcoin: Short Term Cautiously Optimistic, Medium Term Still Cloudy
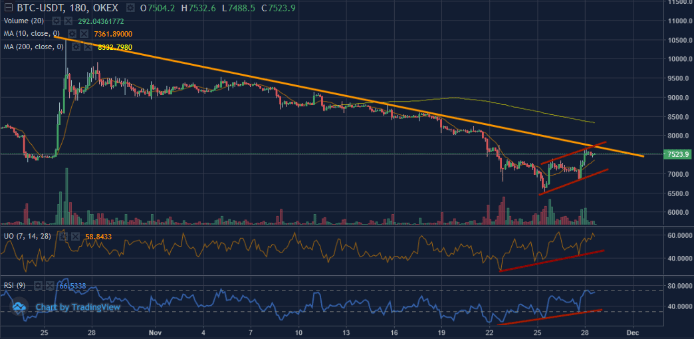
The price of Bitcoin has initially recovered from the November low of $6,513, but the short-term and medium-term outlooks of the leading cryptocurrency could be two different pictures. On the short-term front, preliminary data shows that market sentiment has turned slightly positive alongside the price rebound.
[adinserter block="1"]But the Crypto Fear & Greed Index jumped, which jumped from 17 (extreme fear) to 32 on September 28, suggesting market participants eased some of their worries as the price stabilized, is still in the “Fear” zone.
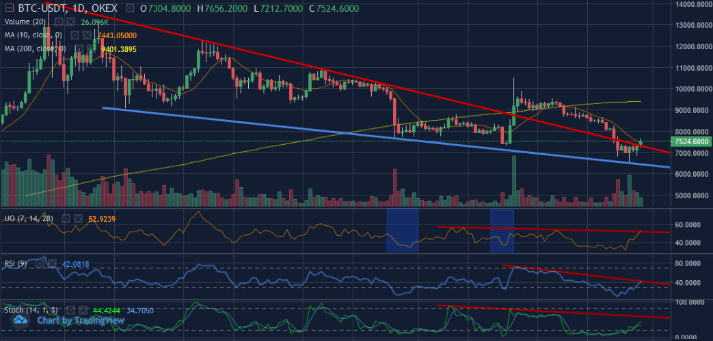
However, things would be less optimistic if we see it from the daily chart perspective. Figure 2b shows an initial daily reversal of BTCUSDT and the rebound has sent the price back above the June resistance levels (red line). We watched the October rally send the price above the resistance levels; however, the pair has failed to turn it into support as the rally ran out of steam.
[adinserter block="1"]While the reversal, for now, is still too early to call a real trend reversal, we would like to see those momentum indicators produce some higher highs, and so far, that has not happened. If the rally momentum fails to sustain, a retest of the blue support line can not be ruled out.
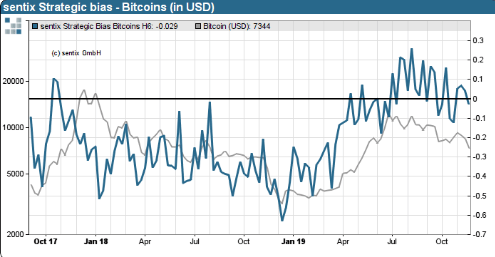
From a longer-term perspective, data from Sentix suggests that some investors still believe that Bitcoin remains overvalued. The Sentix Bitcoin Strategic Bias measures investors’ six-month perception value of Bitcoin. It reflects the strategic view of market participants as well as their underlying convictions and perceptions of value for the cryptocurrency market. The Bias has been moving in a down channel since August. The negative perception could hinder momentum for investors getting into the market at this point, especially for long-term HODLers.
Alt-Season: Long Way to Go
While major altcoins are already off their recent lows, we are still very far away from a true start of an “Alt-Season”.
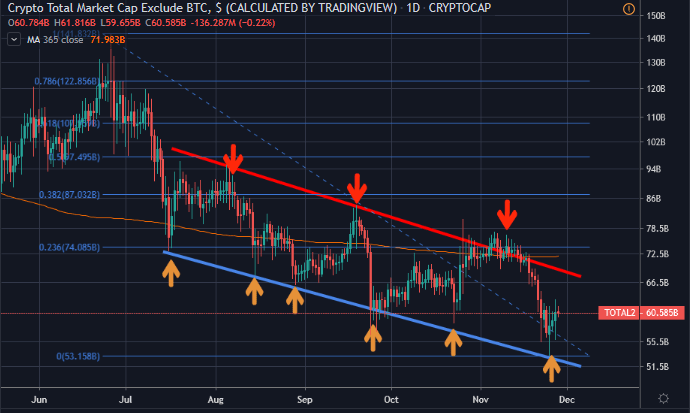
The broader altcoins have made their third attempt to breakout from the market cap downward channel in early November. At the same time, they’ve tried to break above the 365-day moving average (orange line). As the rally momentum fades, altcoins retreated into the channel in late November.
The lower end of the channel (blue line) seems like decent support at this point. However, as the overall conservative sentiment lingers, we believe that more consolidation is needed for the altcoin market cap before the next breakout attempt happens. This chart could be a quick way to measure the broader altcoin market perceptions.
This post originally appeared on OKEx Blog. Read more.
[adinserter block="1"]Disclaimer: This material should not be taken as the basis for making investment decisions, nor be construed as a recommendation to engage in investment transactions. Trading digital assets involve significant risk and can result in the loss of your invested capital. You should ensure that you fully understand the risk involved and take into consideration your level of experience, investment objectives and seek independent financial advice if necessary.
About OKEx
OKEx is a world-leading digital asset exchange headquartered in Malta, offering comprehensive digital assets trading services including token trading, futures trading, perpetual swap trading and index tracker to global traders with blockchain technology. Currently, the exchange offers over 400 token and futures trading pairs enabling users to optimize their strategies.
Follow us on Twitter.
Check our latest press material on Press Room.
Follow Us on Twitter Facebook Telegram