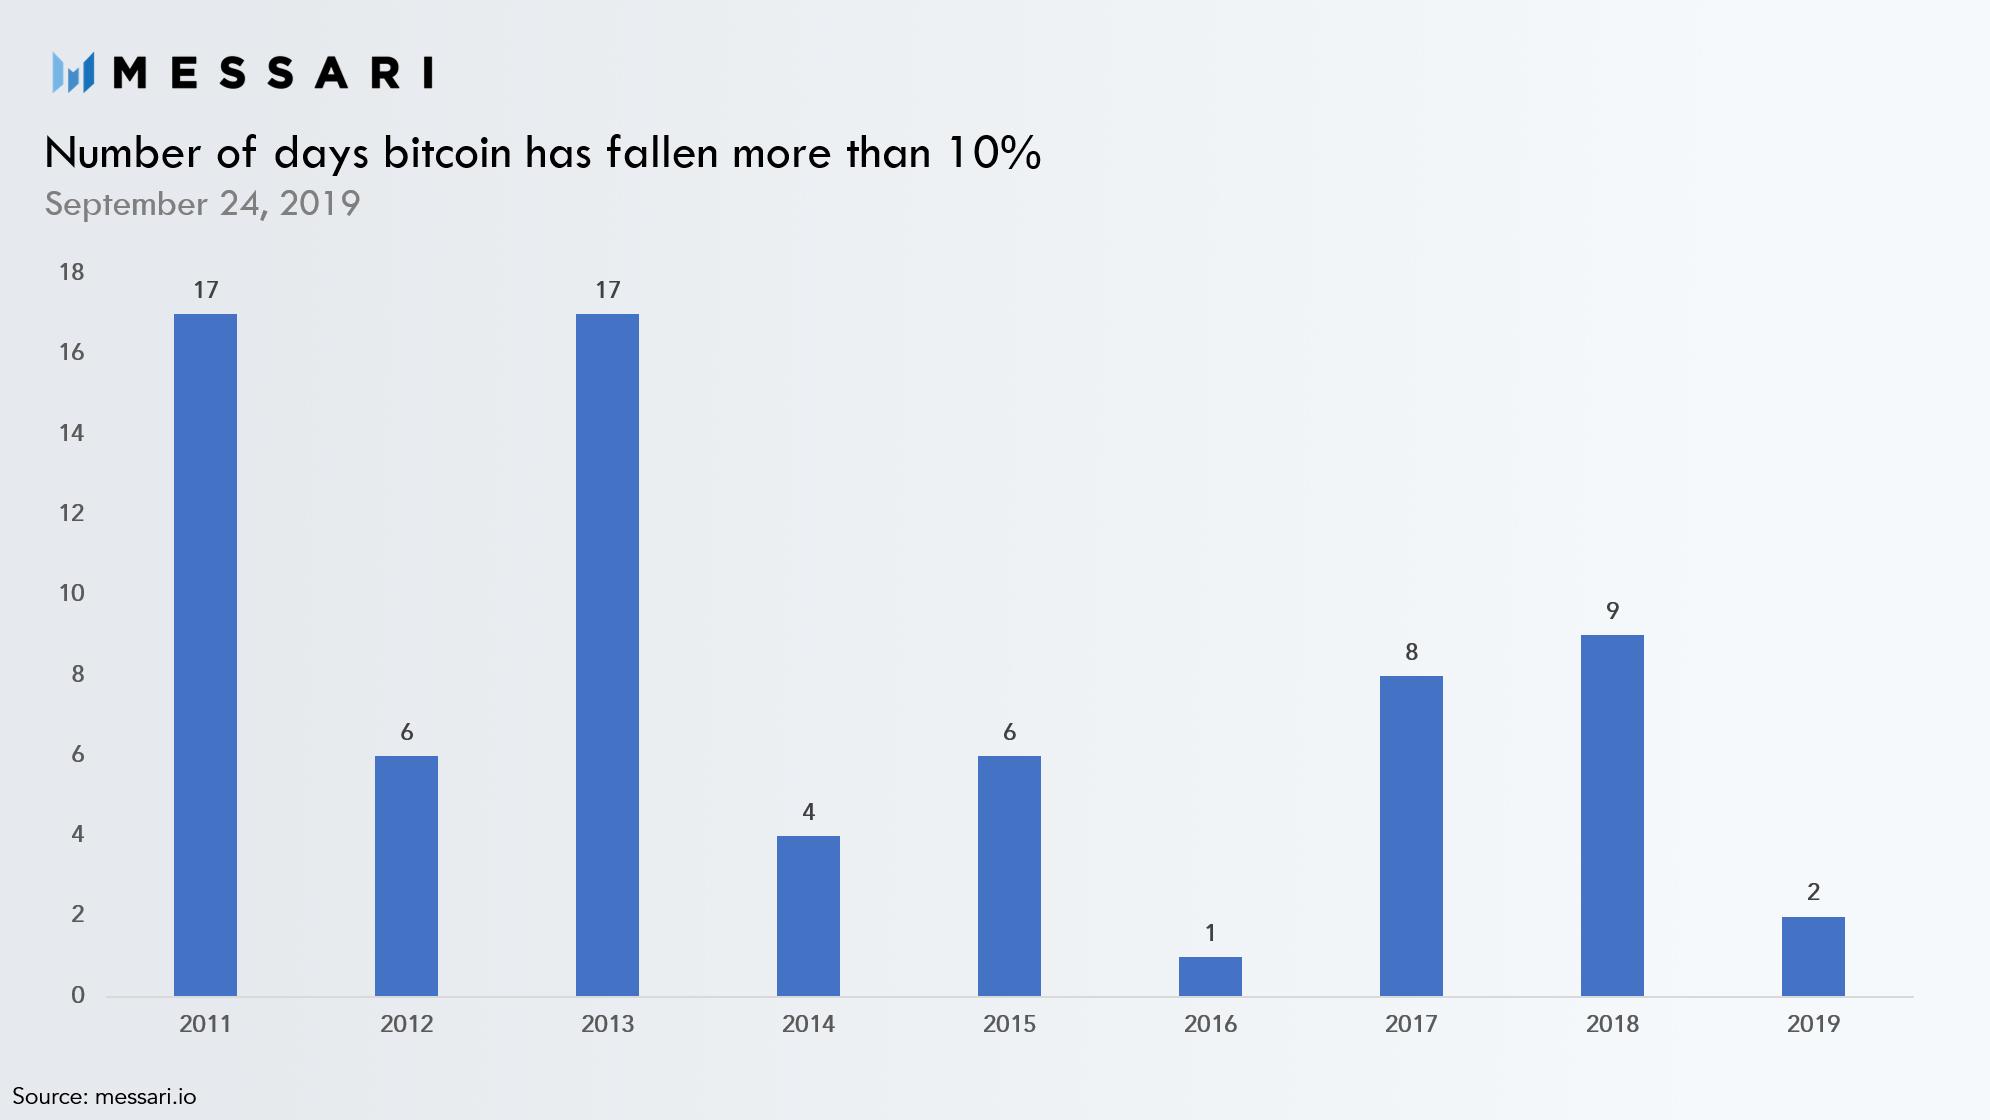
As Bitcoin, the world’s leading cryptocurrency, continues its downward spiral, research indicates that BTC has a long history of surviving rapid and steep declines.
According to data from crypto metrics and research firm Messari, history is repeating itself.
“While bitcoin BTC is down well into double digits, similar losses occurred throughout its history. 70 different times bitcoin has fallen more than 10% representing 2.4% of total days over the last eight years (since August 1, 2011).”

Analysts in the crypto community are pointing to other key metrics to prove Bitcoin’s resilience.
Despite BTC’s dramatic slide on Tuesday from $9,781 to $8,421, according to data compiled by CoinMarketCap, the volatile asset has more than doubled in value since the start of the year when BTC was trading at $3,579.
Bitcoin's price on Sept. 25th:
2010: 6¢
2011: $4
2012 $12
2013: $129
2014: $410
2015: $235
2016: $602
2017: $3,776
2018: $6,430
2019: $8,453Bitcoin is the best performing asset in history.
— Rhythm (@Rhythmtrader) September 25, 2019
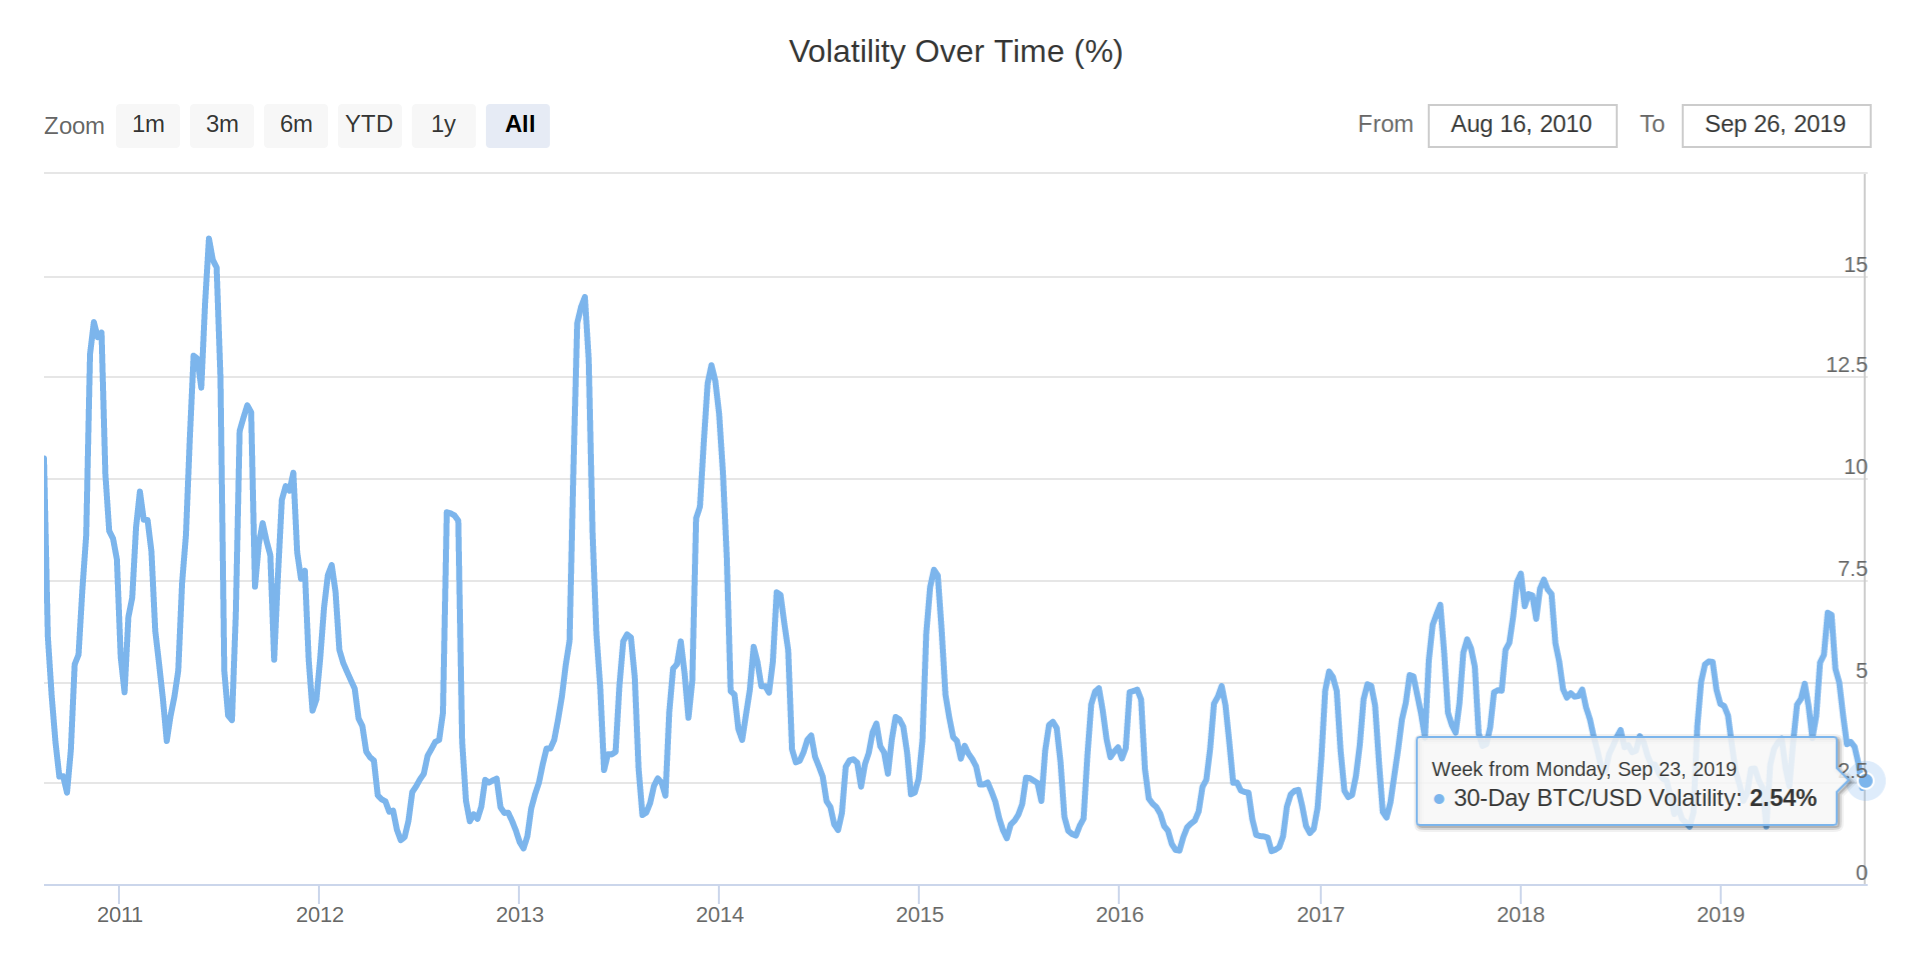
Despite a rough ride over the past 72 hours, Bitcoin’s volatility index is currently around 3.8%, trending downward over time as the asset class matures.
The 30-day BTC/USD volatility rate peaked in June of 2011, hitting 15.91%.

On Thursday, Bitcoin plunged further to a low of $7,926 and is currently trading at $8,150, at time of writing.


