HodlX Guest Post Submit Your Post
Market sentiment is the public interest in the underlying assets and the behavior of traders on derivatives markets. Thanks to sentiment analysis, one can identify the attitude of long-term investors as they always sell during the uptrend to short-term speculators and buy the dips with a statistically positive expectation.
On the contrary, the crowd psyche is irrational as buying with spiking candlesticks in fear of missing out and dumping in the downtrend.
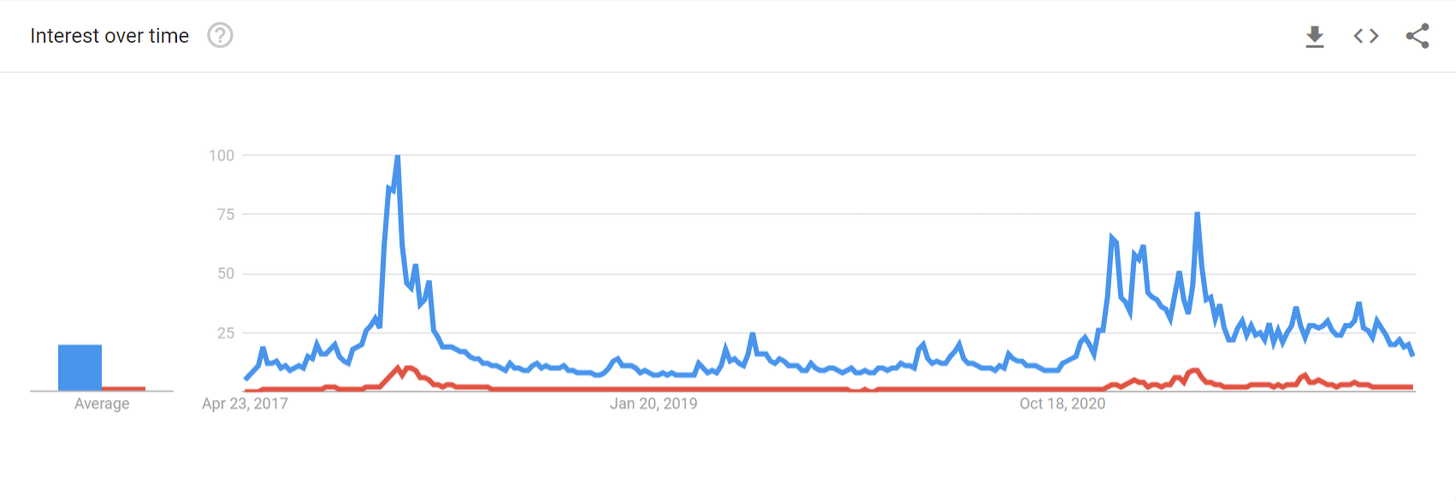
The public interest has cooled off as shown in Google trend data.
The first thing to be taken into account when analyzing market sentiment is the fund volume, which plays a pivotal role in whether the market is trending or consolidating as it depicts the trading volume of coins. In a bull market, fund volume increases along with the price and vice versa. But it has gradually decreased since the peak of May 2021.
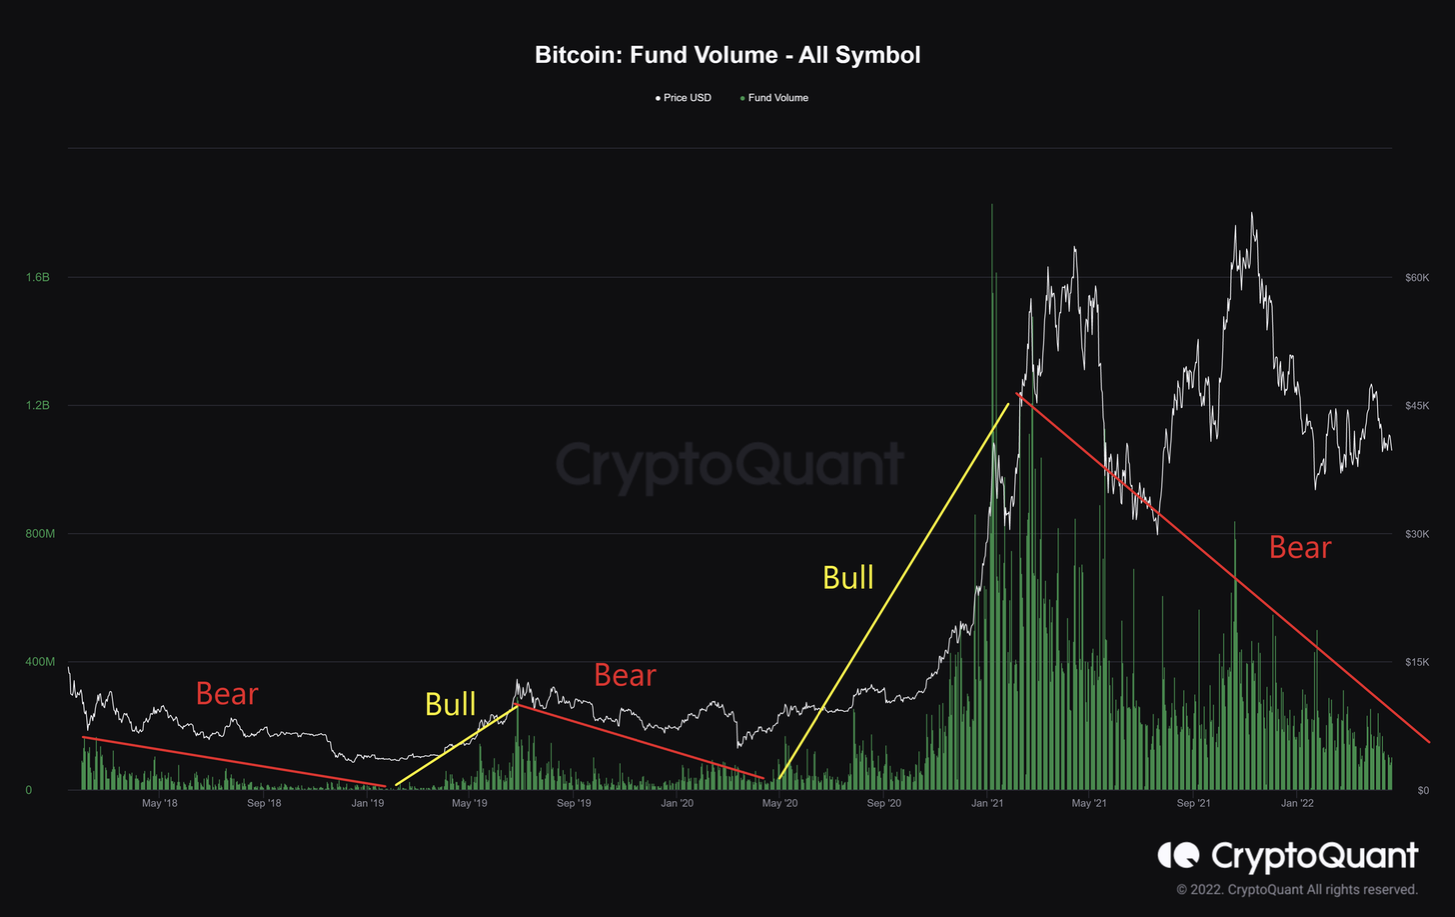
The fund volume increasing in bull and decreasing in bear.
Concurrently, having looked at the ratio of buy volume divided by sell volume of takers in perpetual swap trades, values over one more buy orders taken via market order indicate bullish sentiment is dominant. Similarly, values under one indicate the dominance of bearish sentiment as more sell orders actively executed through market orders.
Also, EMA-14 of the ‘taker buy/sell ratio’ has been negative and recently retested the level of one, suggesting that more sellers are willing to sell coins at a lower price and that selling pressure is stronger than the buying pressure.
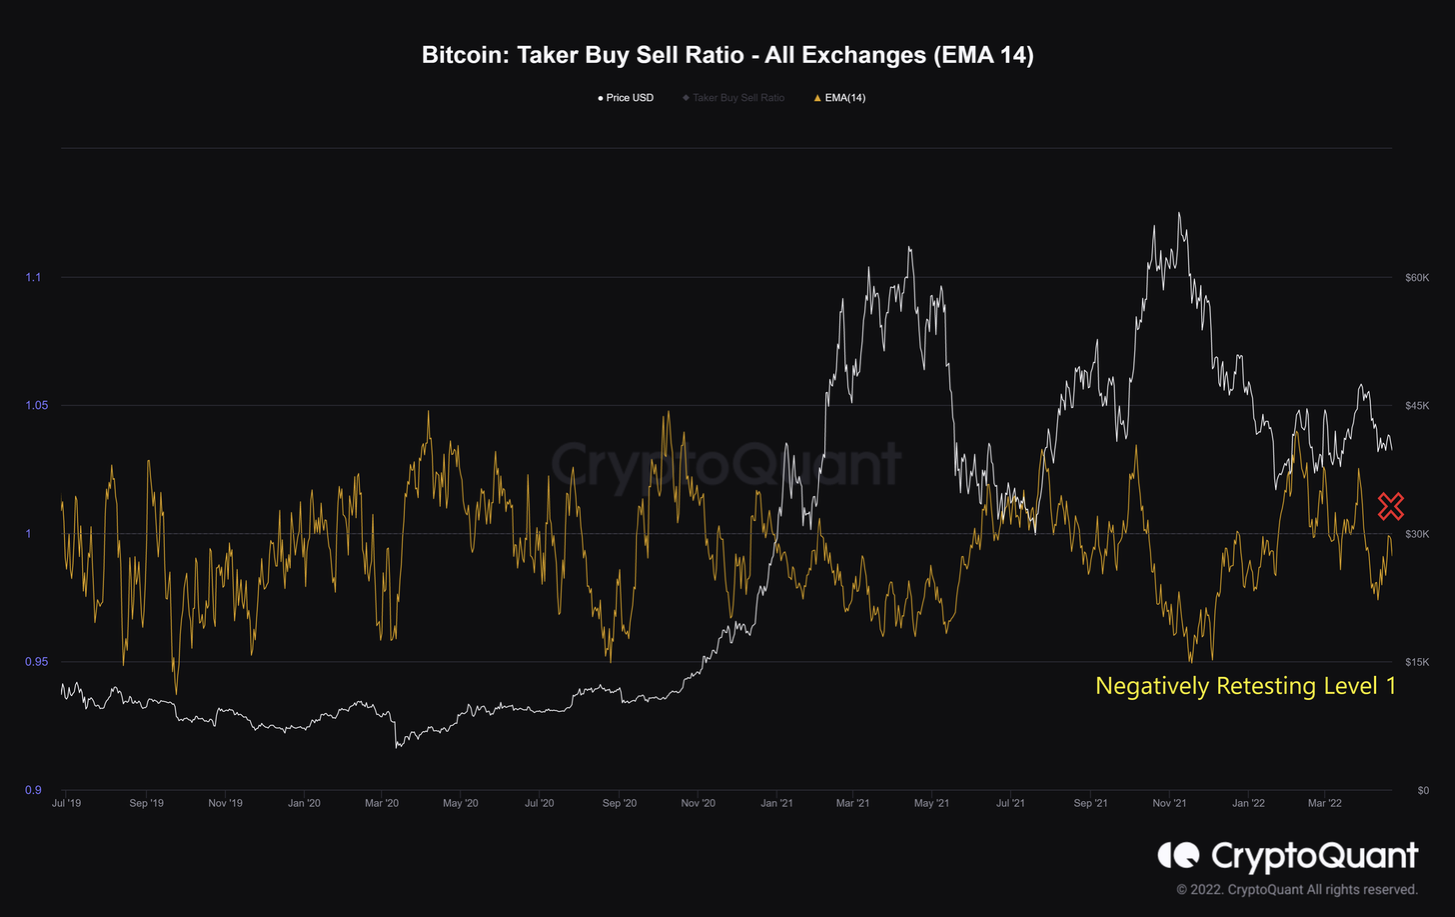
Taker buy/sell ratio EMA-14 in negative zone, and retesting the level one.
In a bull market, there is an increasing liquidation in correlation to the rise in price. The current total amount of liquidated long and short positions in the derivatives market is relatively low compared with the previous bull runs.
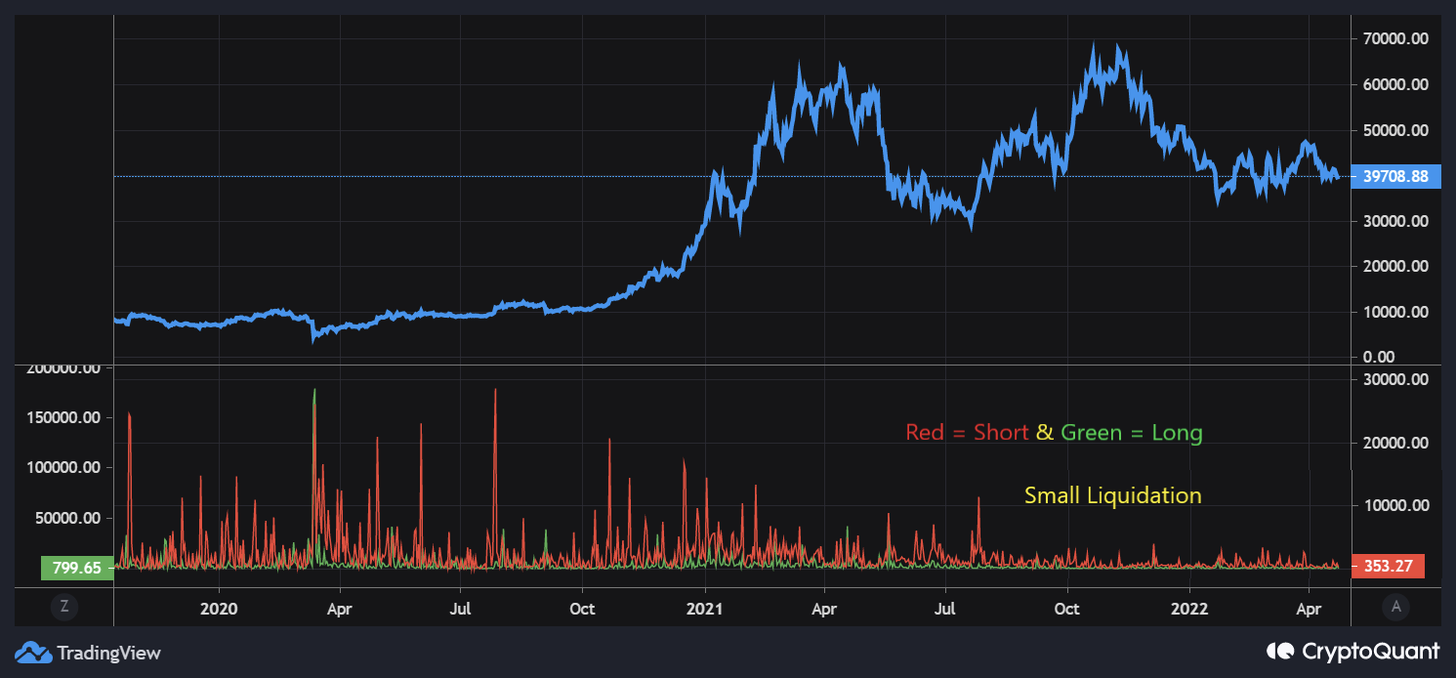
Small liquidation signaling bearish sentiment.
Funding rates represent traders’ sentiment in the perpetual swaps market, and the amount is proportional to the number of contracts. Positive funding rates indicate that long position traders are dominant and are willing to pay funding to short traders. Negative funding rates indicate that short position traders are dominant and are willing to pay long traders.
The higher the absolute value of the funding rate is the more aggressive the traders are. However, the current absolute value of the funding rate has been hovering near zero, which means traders are not aggressive under the prevailing economic conditions.
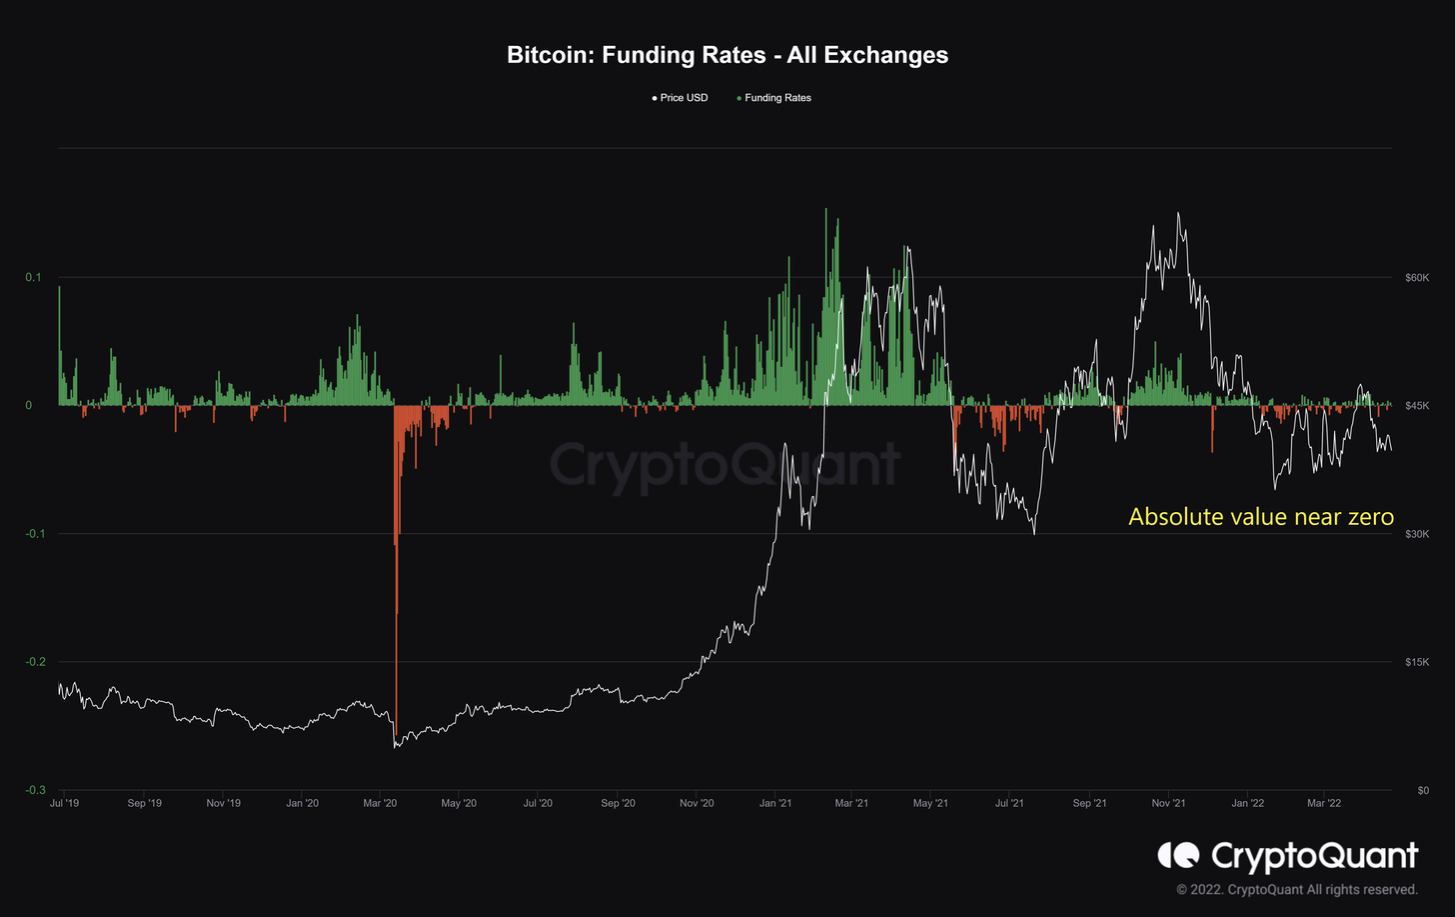
Funding’s absolute value near zero affirming no aggressiveness among traders.
One of the most significant factors of the derivatives market is open interest (OI), defined as the number of open positions currently on a derivative exchange’s trading pairs. The increasing OI from March 8, 2022, to March 28, 2022, is overheated deliberately driven by the short-term traders as there was an open-ended capitulation that initiated at the peak of $48,000 on March 28. Hence, it’s not capable of supporting a possible uptrend.
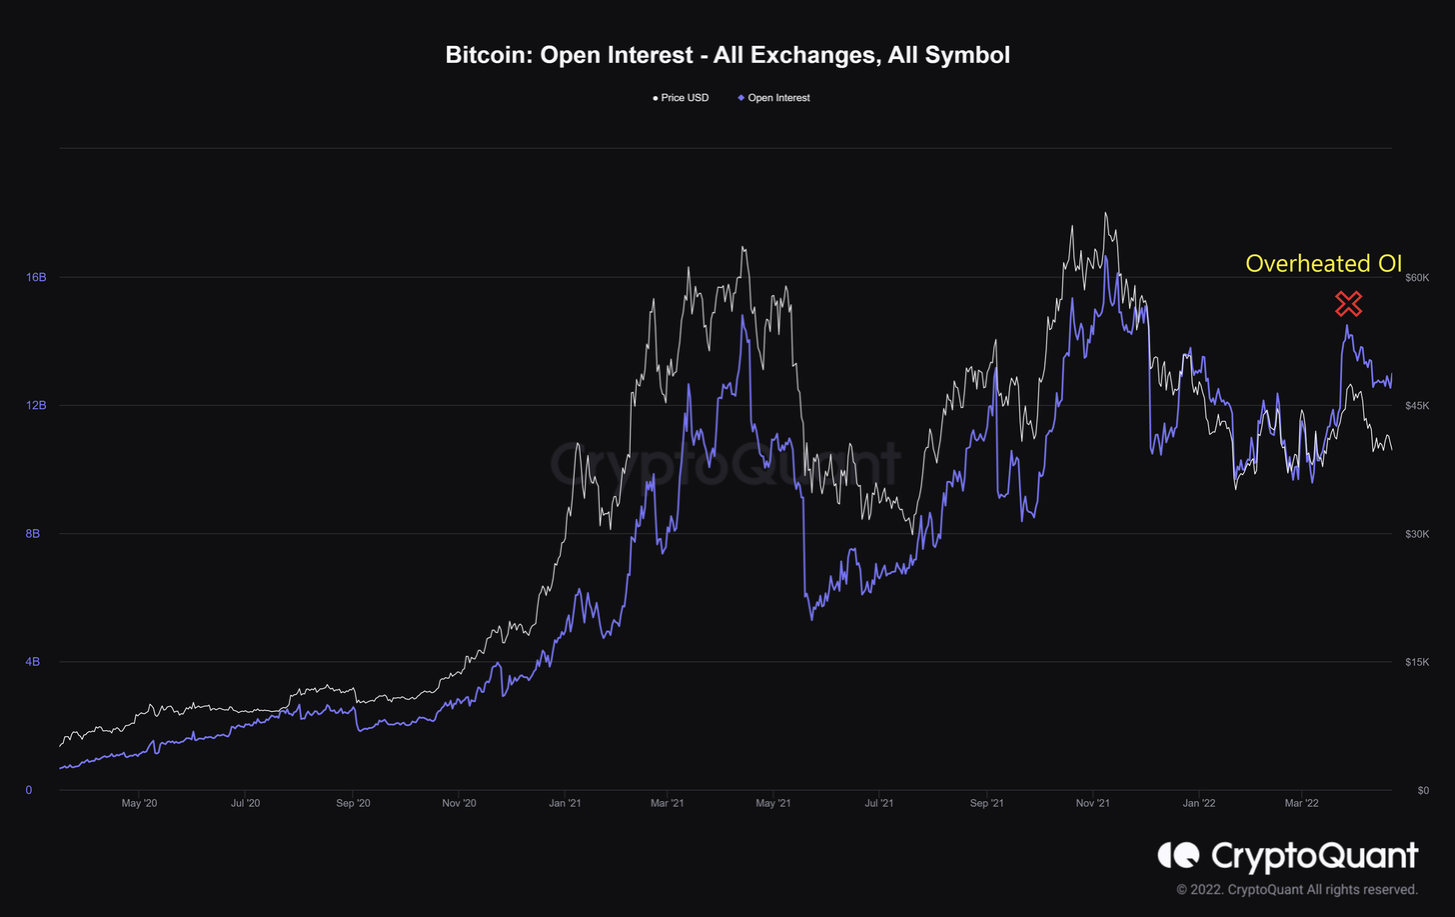
Overheated OI driven by short-term traders plummeting as a capitulation.
Meanwhile, the total number of coins held in the spot exchange has hit a four-year low, and this is often considered a good sign in the fundamental on-chain activity.
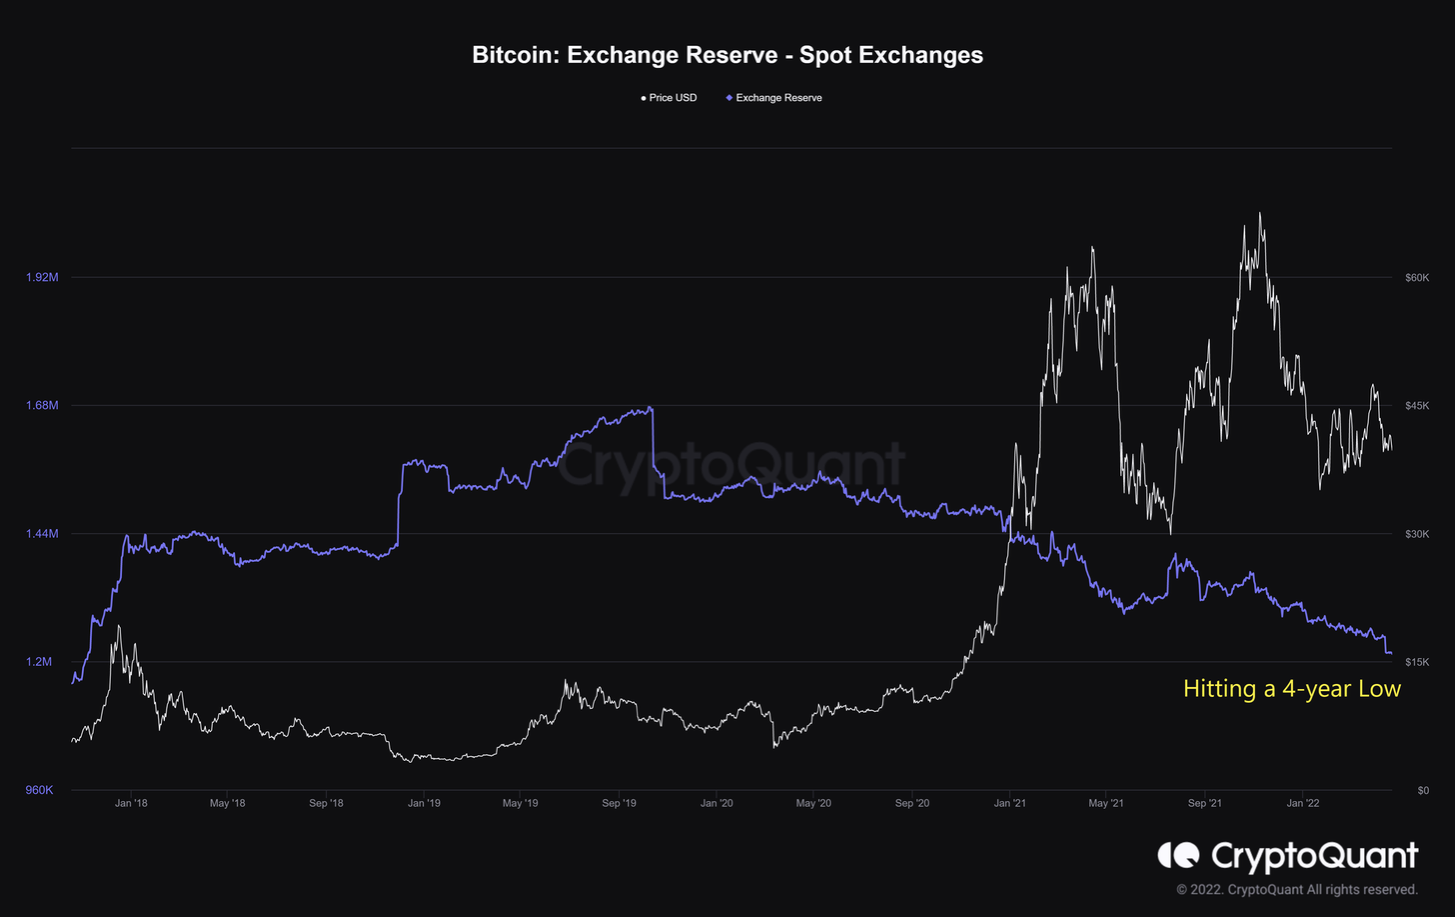
The spot exchange reserve hit a four-year low as a good sign.
But more importantly, it may not be the retail’s activity as the exchange outflow addresses count has plummeted since May 10, 2021. It suggests that not many retail investors move those coins off of exchanges nstead, that could be the whale accumulation.
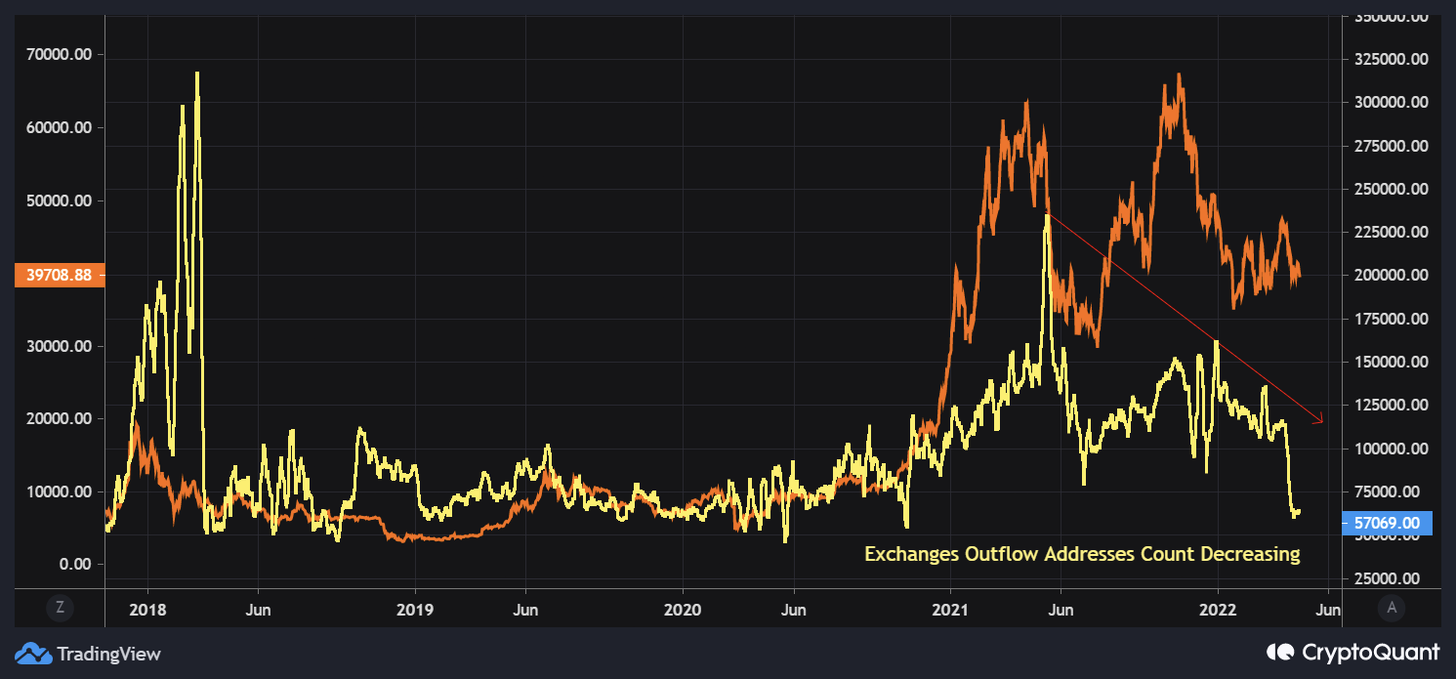
The exchange outflow address plummeting as retails are less active.
In addition, the downtrend in exchanges’ reserve and overheated OI make the estimated leverage ratio higher, calculated by the exchange’s open interest divided by their coins reserve. It reveals that higher leverage is used by users on average (i.e., more investors are taking high leverage risk in the derivatives trade).
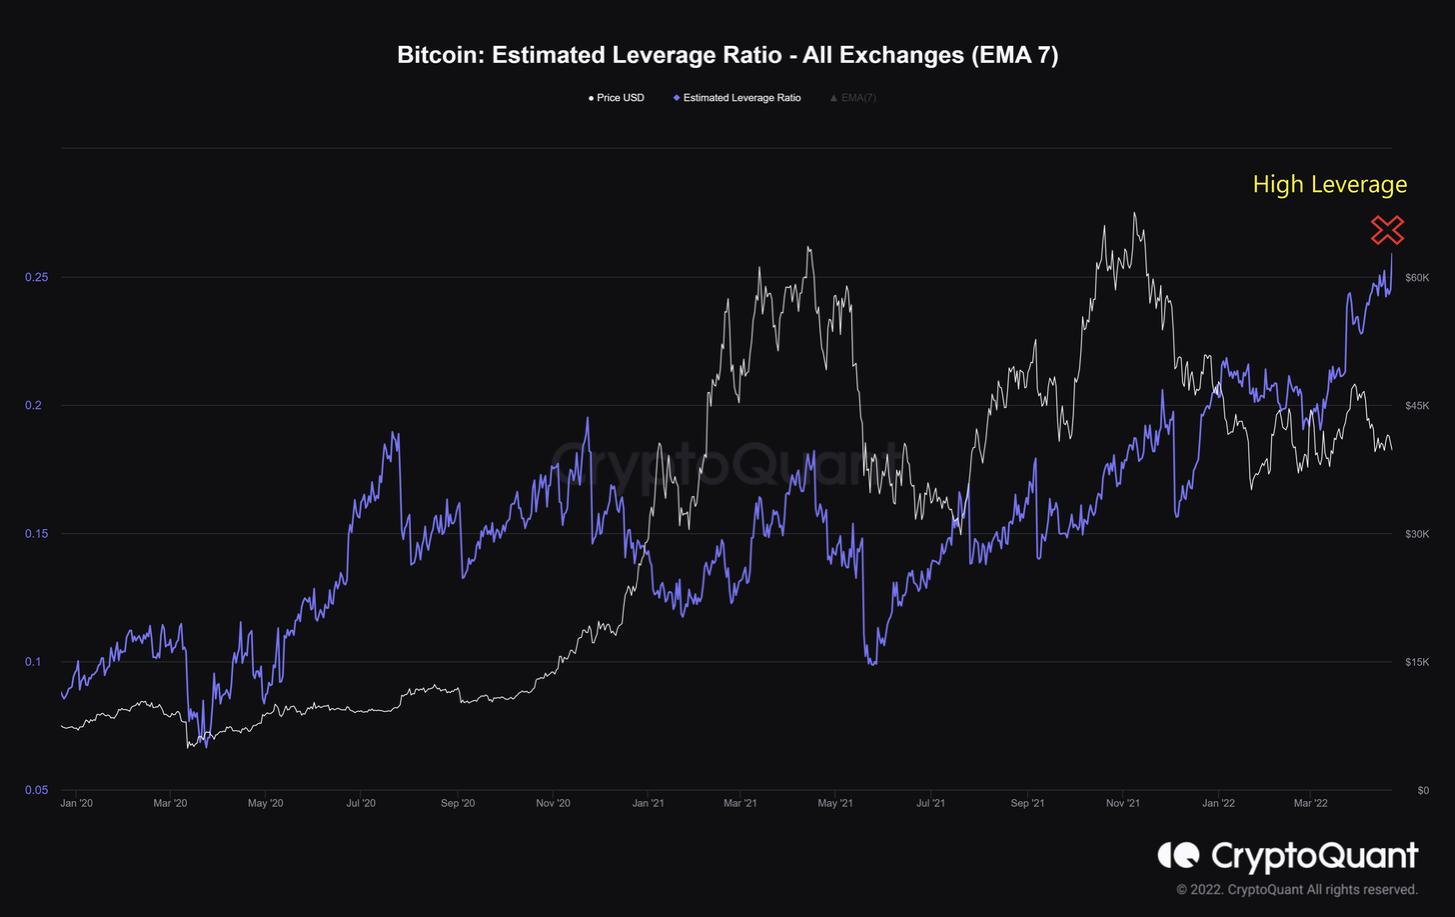
Heated leverage makes the market riskier.
Last but not least, ‘net unrealized profit and loss’ (NUPL) the difference between market cap and realized cap divided by market cap indicates the capitulation phase has begun since May 2021. The maximal value of the ratio of investors who are in profit was in that day, and the sell-off has ensued.
At the moment, Bitcoin may be in the middle of this phase with the plausible reason to take profit until no more selling pressure.
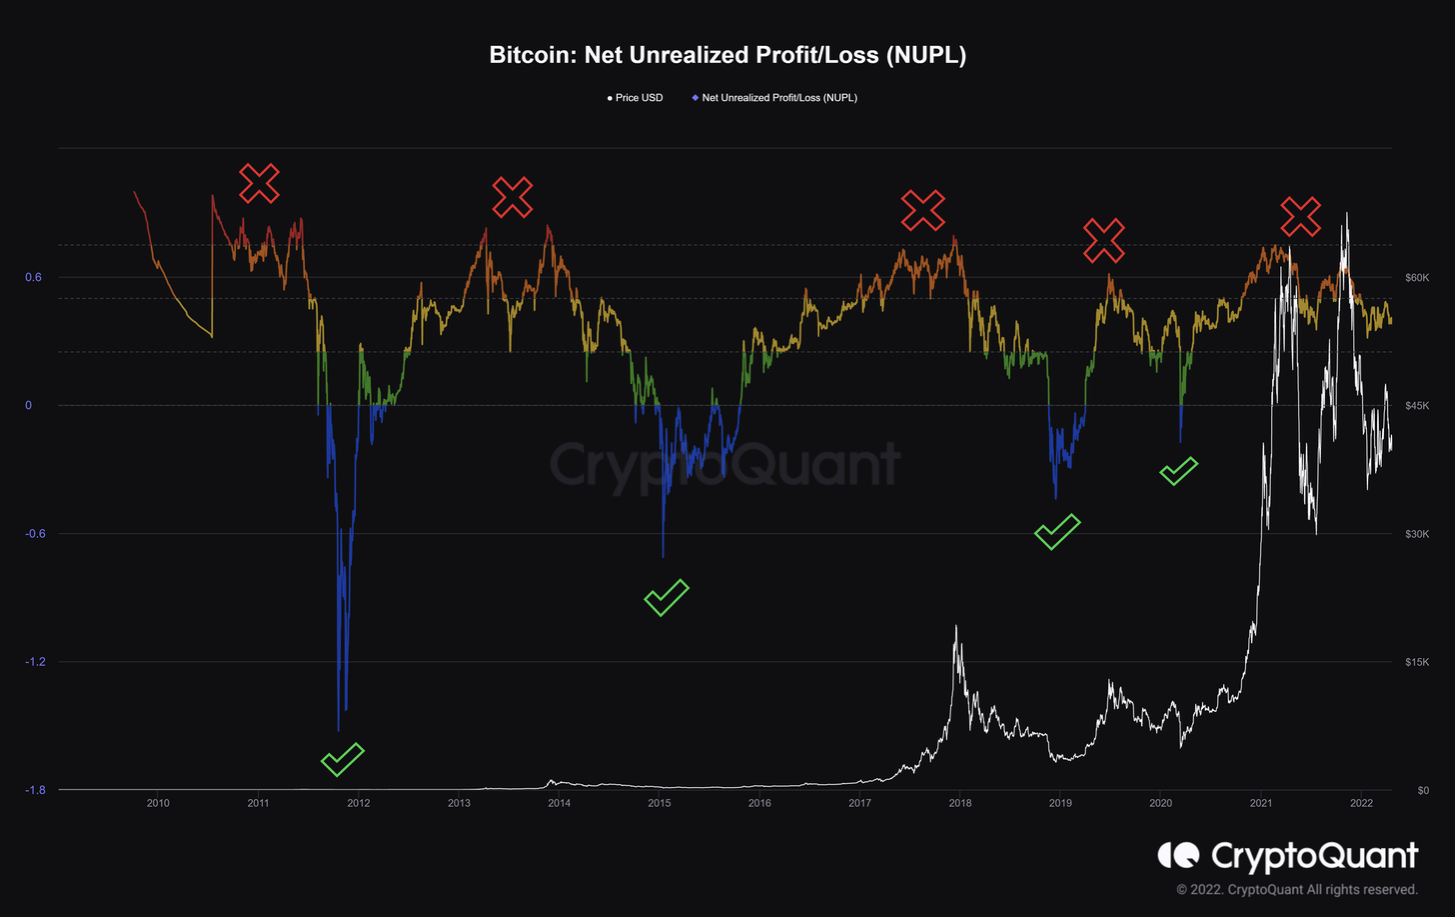
NUPL supposing the market being in the semi-capitulation phase.
On balance, market sentiment is not as strong as on-chain activity. There is the likelihood that we are in a semi-bear market wherein the ongoing capitulation has taken effect since May 2021, and the continuing accumulation phase has appeared to wipe out the short-term speculators.
Dang Quan Vuong is a trader and market analyst at King Stock Capital Management and on-chain analyst at CryptoQuant and Santiment Vietnam.
Follow Us on Twitter Facebook Telegram

Disclaimer: Opinions expressed at The Daily Hodl are not investment advice. Investors should do their due diligence before making any high-risk investments in Bitcoin, cryptocurrency or digital assets. Please be advised that your transfers and trades are at your own risk, and any loses you may incur are your responsibility. The Daily Hodl does not recommend the buying or selling of any cryptocurrencies or digital assets, nor is The Daily Hodl an investment advisor. Please note that The Daily Hodl participates in affiliate marketing.
Featured Image: Shutterstock/klyaksun/MicroOne


