HodlX Guest Post Submit Your Post
Key data
- Average number of Ethereum transactions per day decreased insignificantly.
- Average number of Ethereum blocks per day increased by 7.4% because of the merge.
- The number of blocks per day and the block size are continuing to increase because of the merge.
- Average Ethereum gas price increased by 31.3% in October because of the chain activity.
- The number of ERC-20 tokens created in the Ethereum network in October increased by 33.4%.
- In October, the average number of unique active crypto wallets per day as well as the average number of daily active smart contracts decreased by 7.4% and 4.6%, respectively.
Ethereum activity index
Ethereum (ETH) activity index shows the activity of users on the Ethereum network. It is calculated automatically based on a combination of several factors, such as active wallets on the network, gas used and transaction statistics.
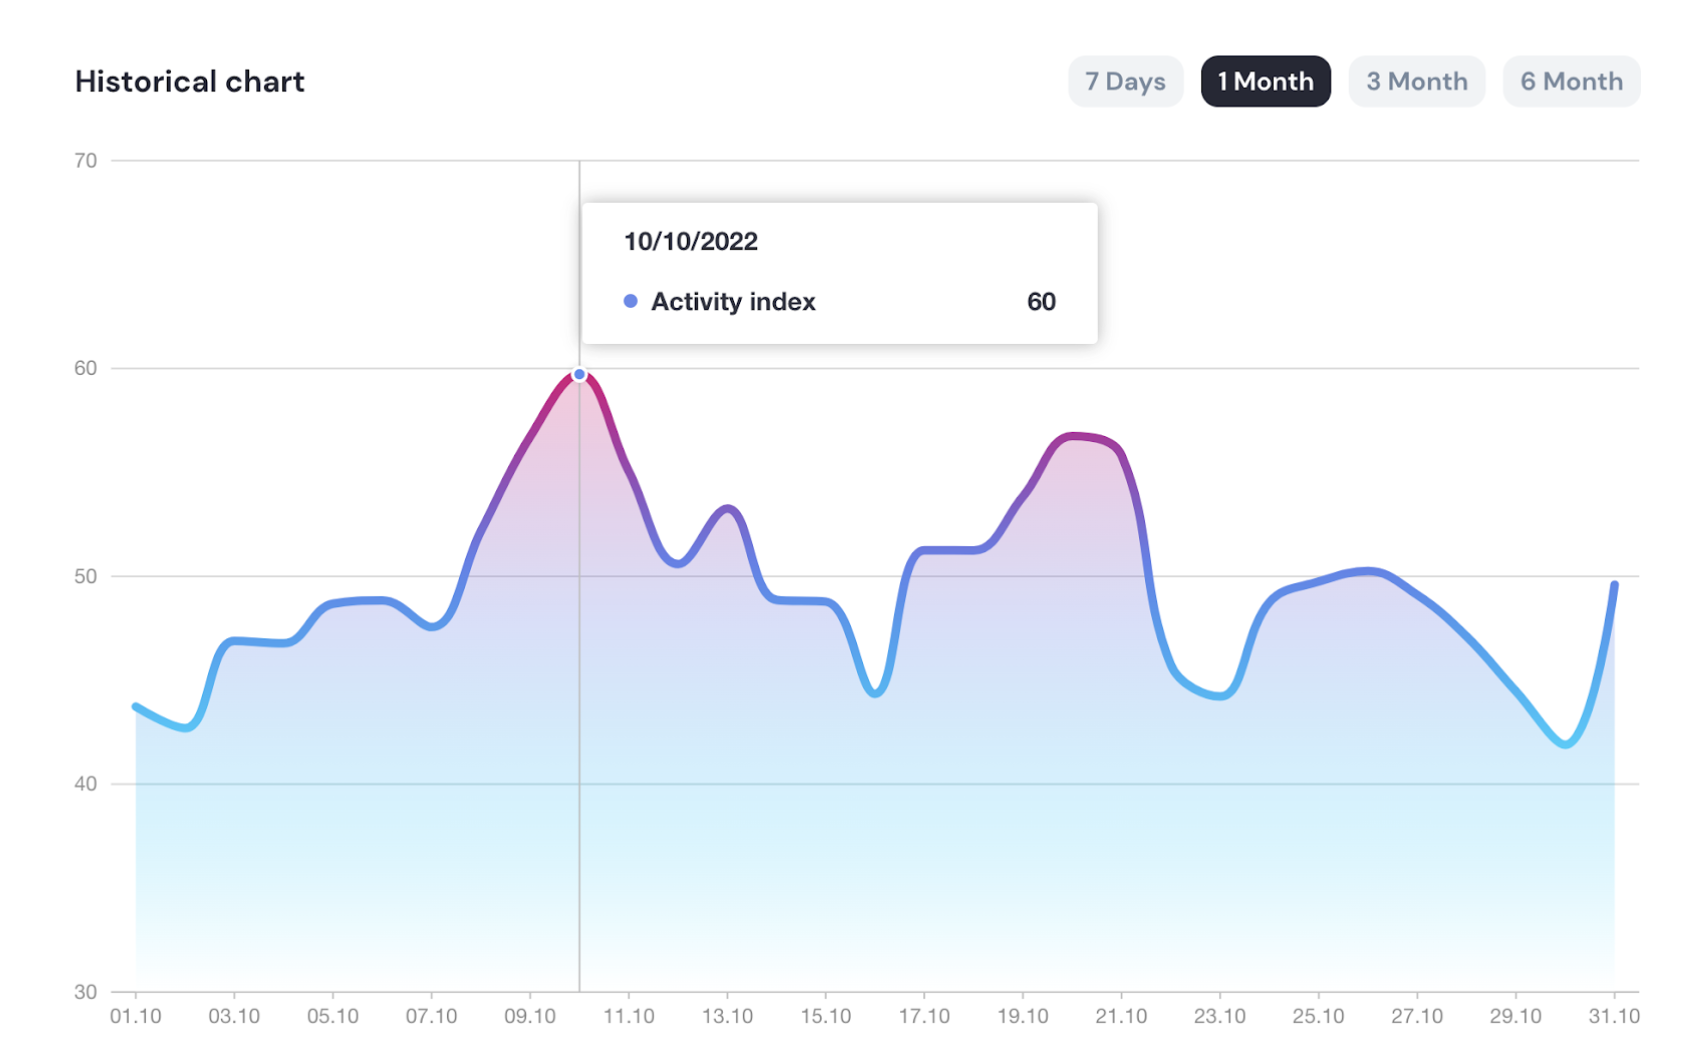
ETH activity index historical chart
The average indicator is bigger than in September in general. In October, the index showed an average of 51 points.
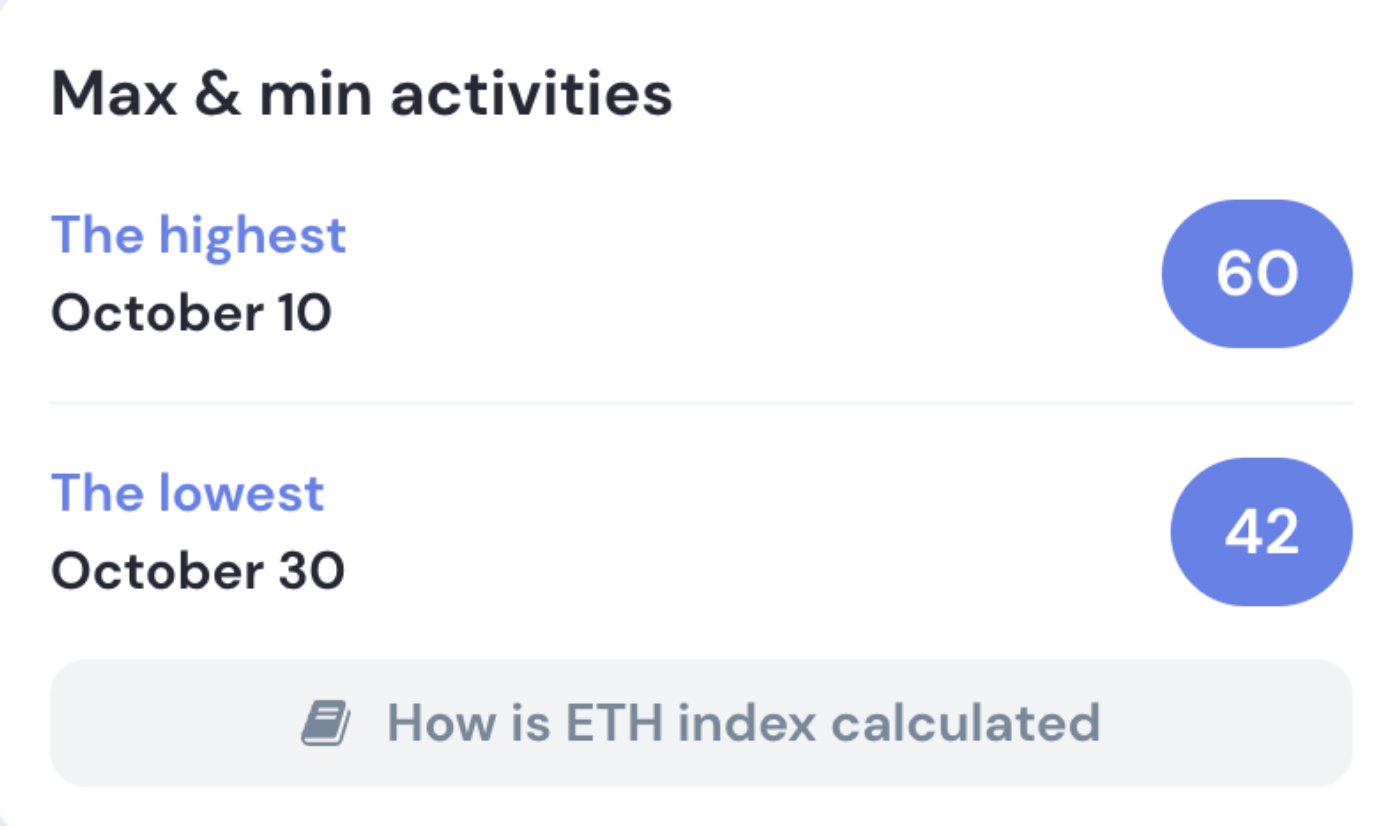
ETH activity index minimum and maximum values
The maximum value was observed on October 10, 2022, and amounted to 60 points. The minimum value was observed on October 30, 2022, and was 42 points.
Ethereum transaction statistics
- Average number of Ethereum transactions per day decreased insignificantly
The total number of Ethereum transactions was 33,741,733, with average daily volume of 1,124,724 transactions in September. The number of Ethereum transactions in October was 34,122,532, with average daily volume of 1,100,726 transactions.
Compared to September, the average number of transactions per day in October decreased by 0.3% continuing the bear trend. The chart below shows that the market is moving sideways in anticipation of a denouement.
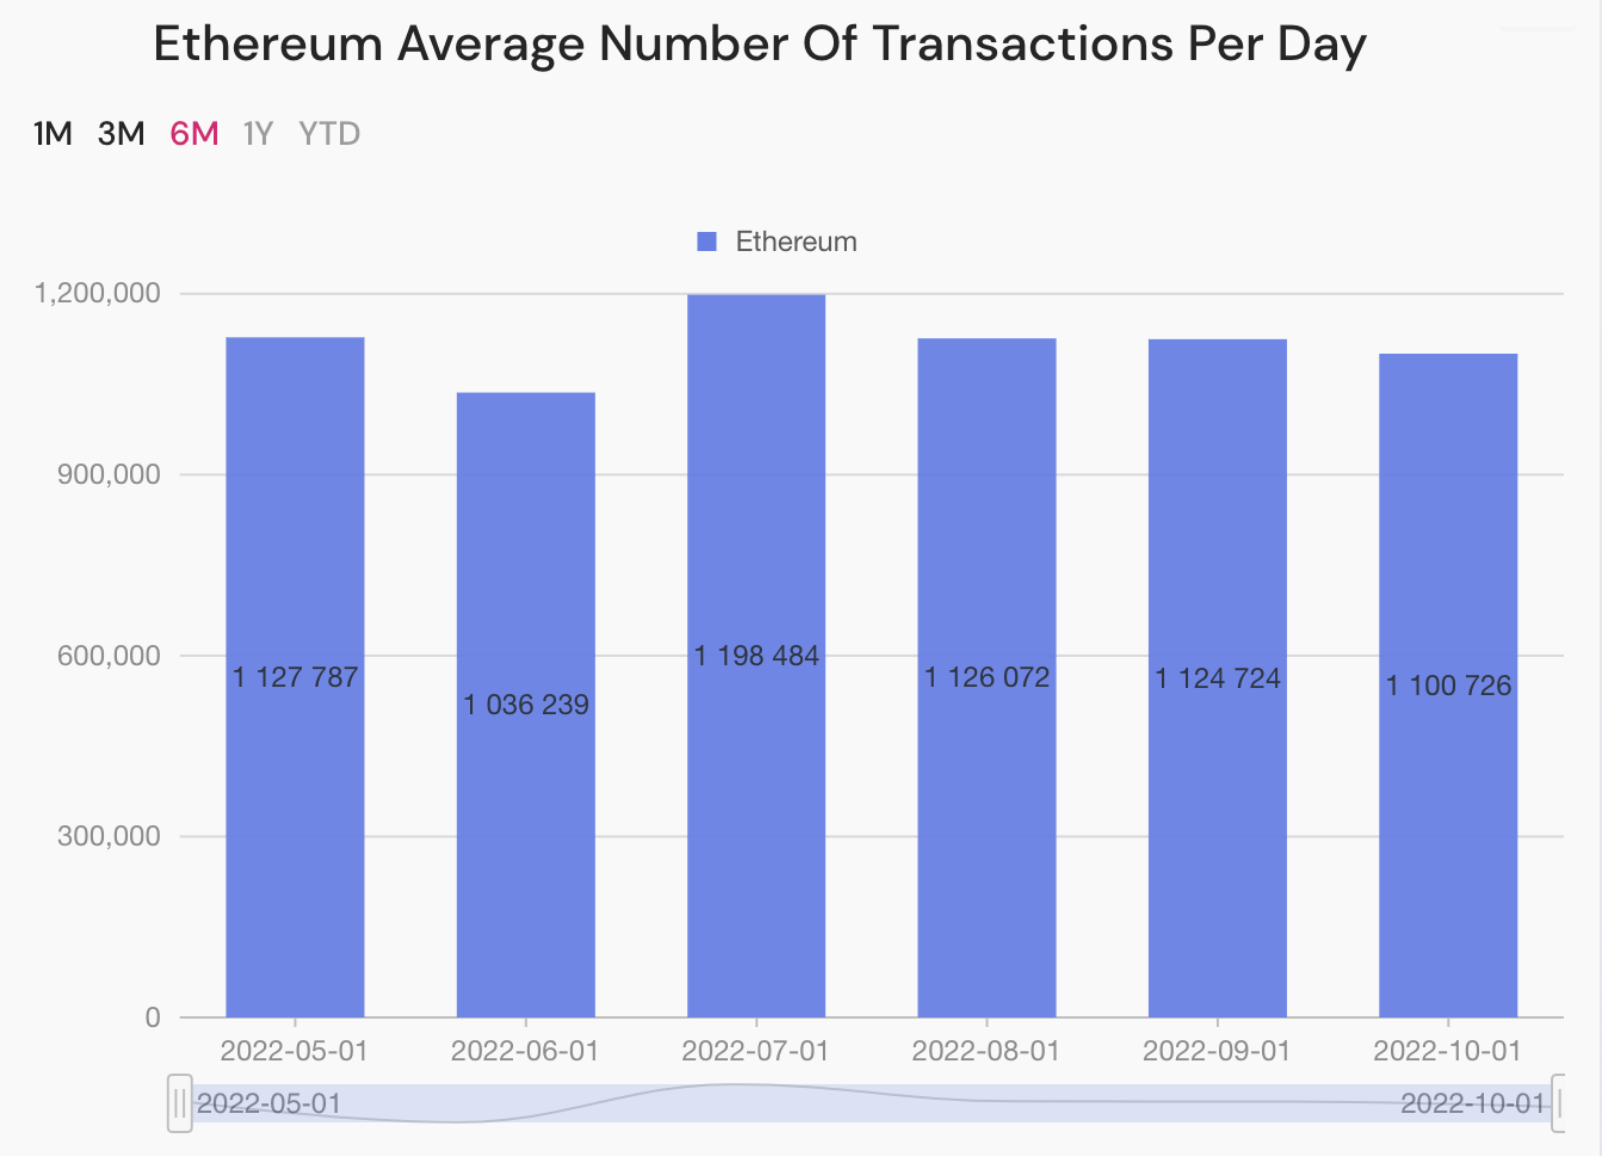
ETH average number of transactions per day
October is not distinguished by significant events and peaks, which reflects the full expectant position of market players. The highest average number of transactions in October was made on the third, with a peak of 1,307,142 transactions.
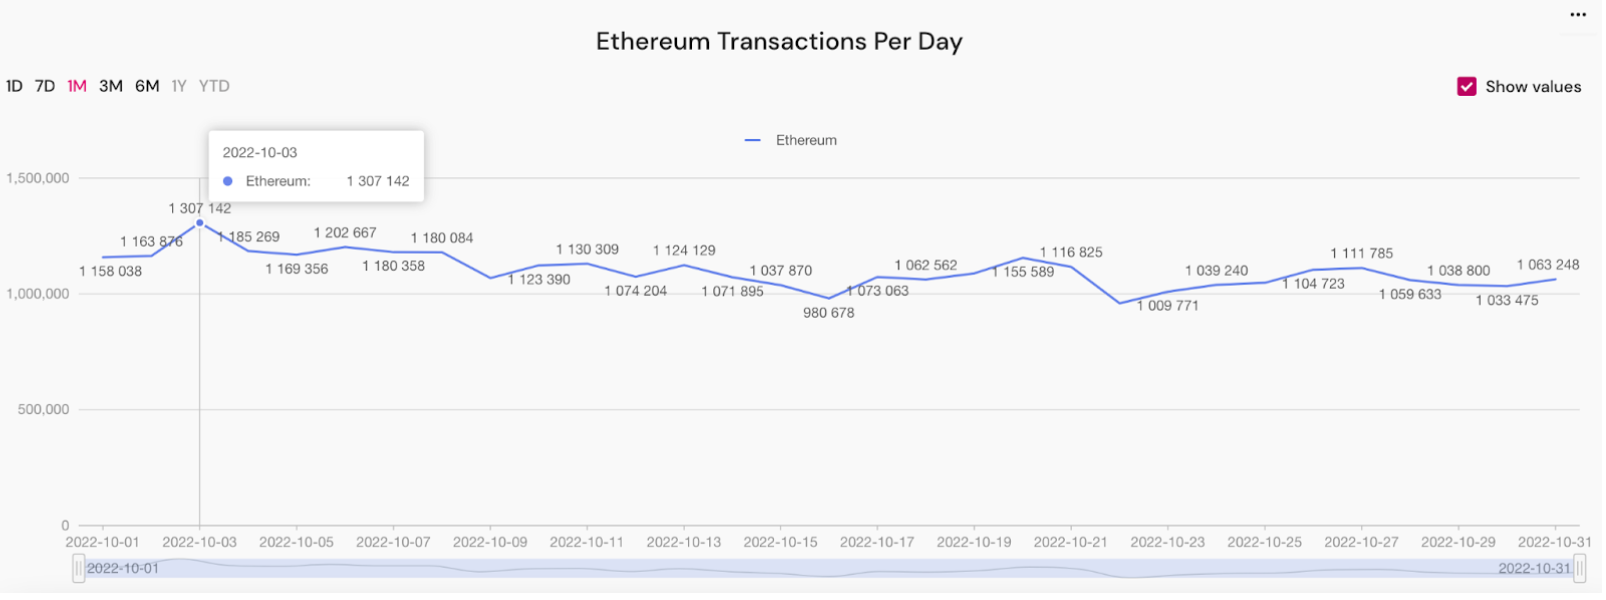
ETH transactions peak
Ethereum block statistics
- Average number of Ethereum blocks per day increased by 7.4% because of the merge.
- The number of blocks per day and the block size are continuing to increase because of the merge.
In October, the Ethereum average number of blocks per day chart shows an increase of 7.4% in the average number of blocks per day. The average number of Ethereum blocks per day in September was 6,665, and the average number of Ethereum blocks in October was 7,157.
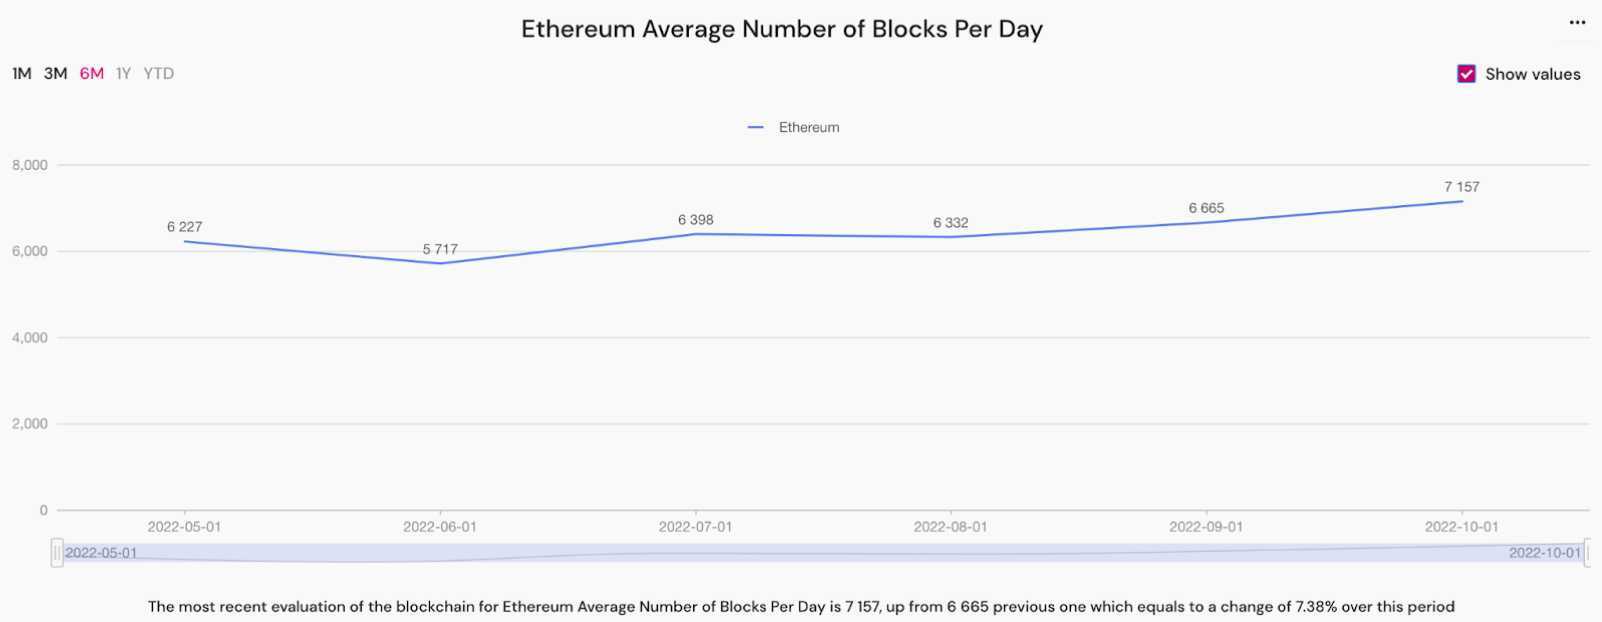
ETH average number of blocks per day
The number of blocks per day increased on September 15, 2022, after the transition of Ethereum to the proof-of-stake system, and in October, it is stable at 7,157 blocks on average. This can be clearly seen in the chart below.
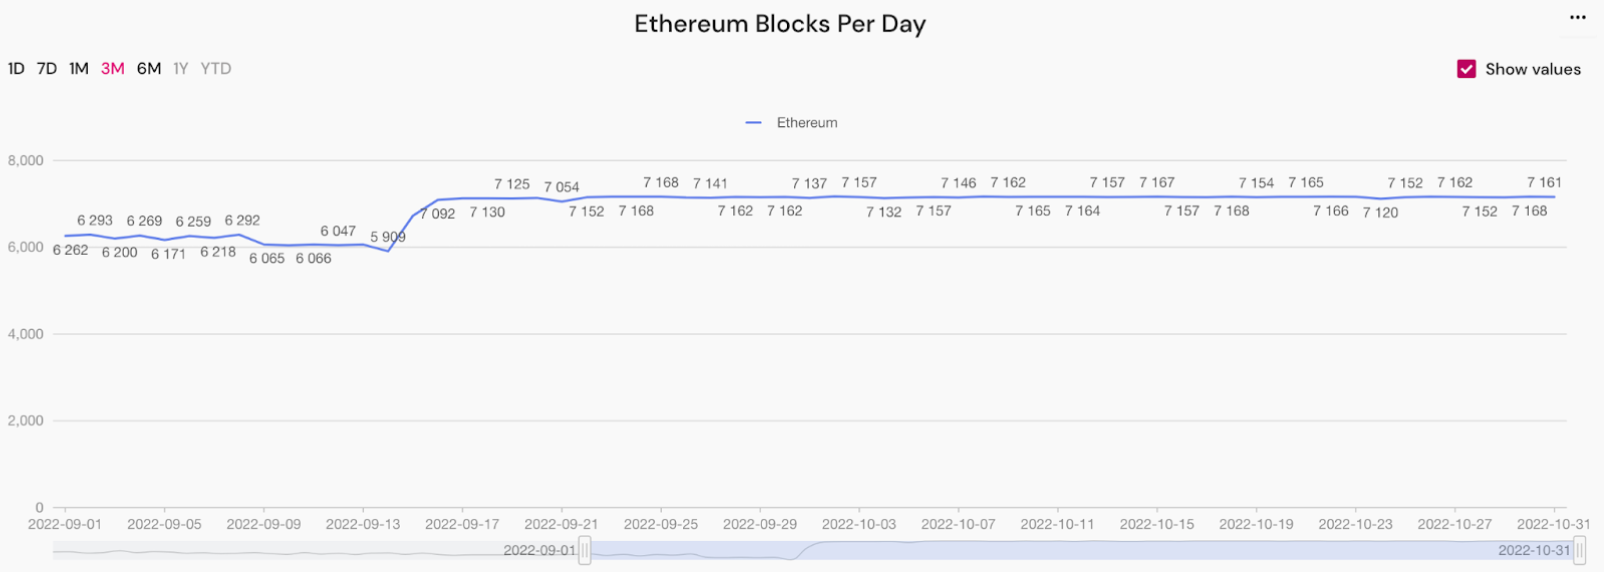
ETH blocks per day
In September, the average block size was 0.49 Gb. In October, this value was 0.50 Gb. The average size of blocks mined per day increased by 2%.
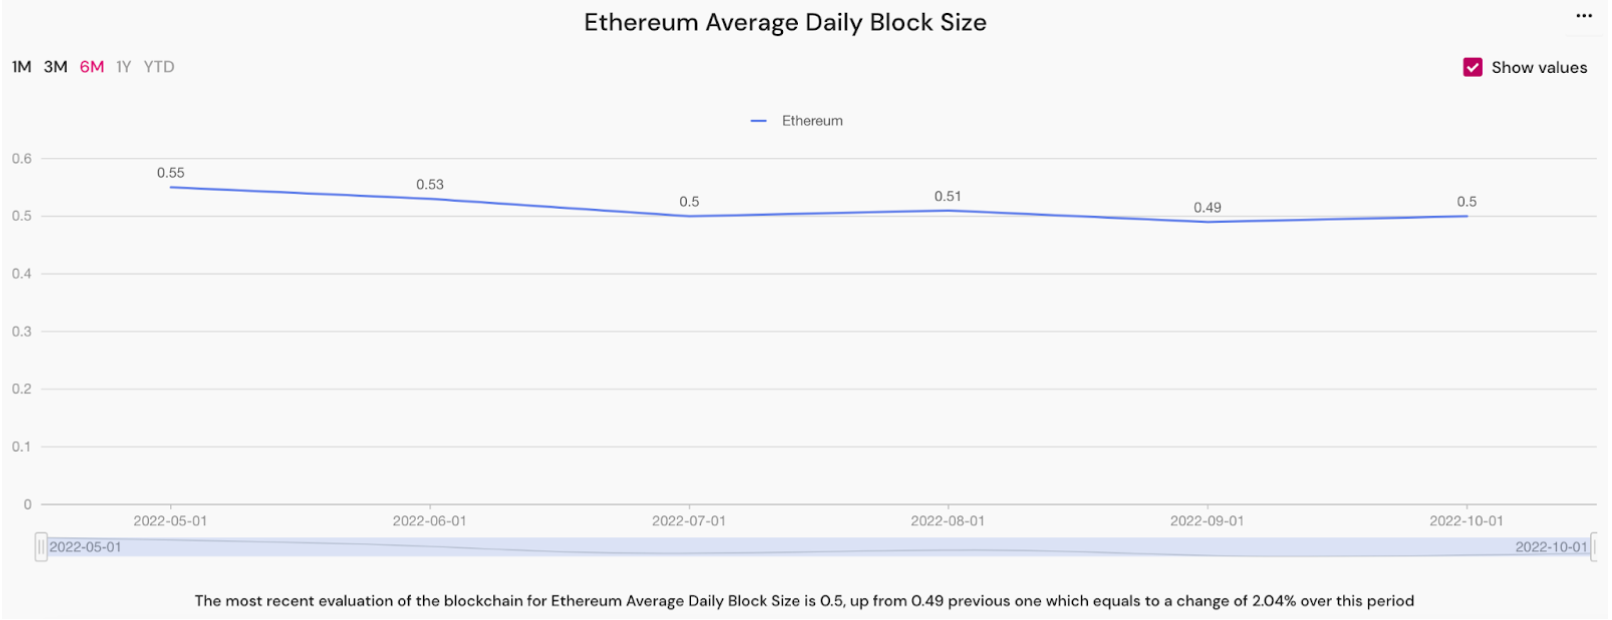
ETH average daily block size
The ETH total block size per month, Gb chart shows that the total block size in September was 14.6 Gb. In October, it was 15.4 Gb. The value has increased by 5.7%.
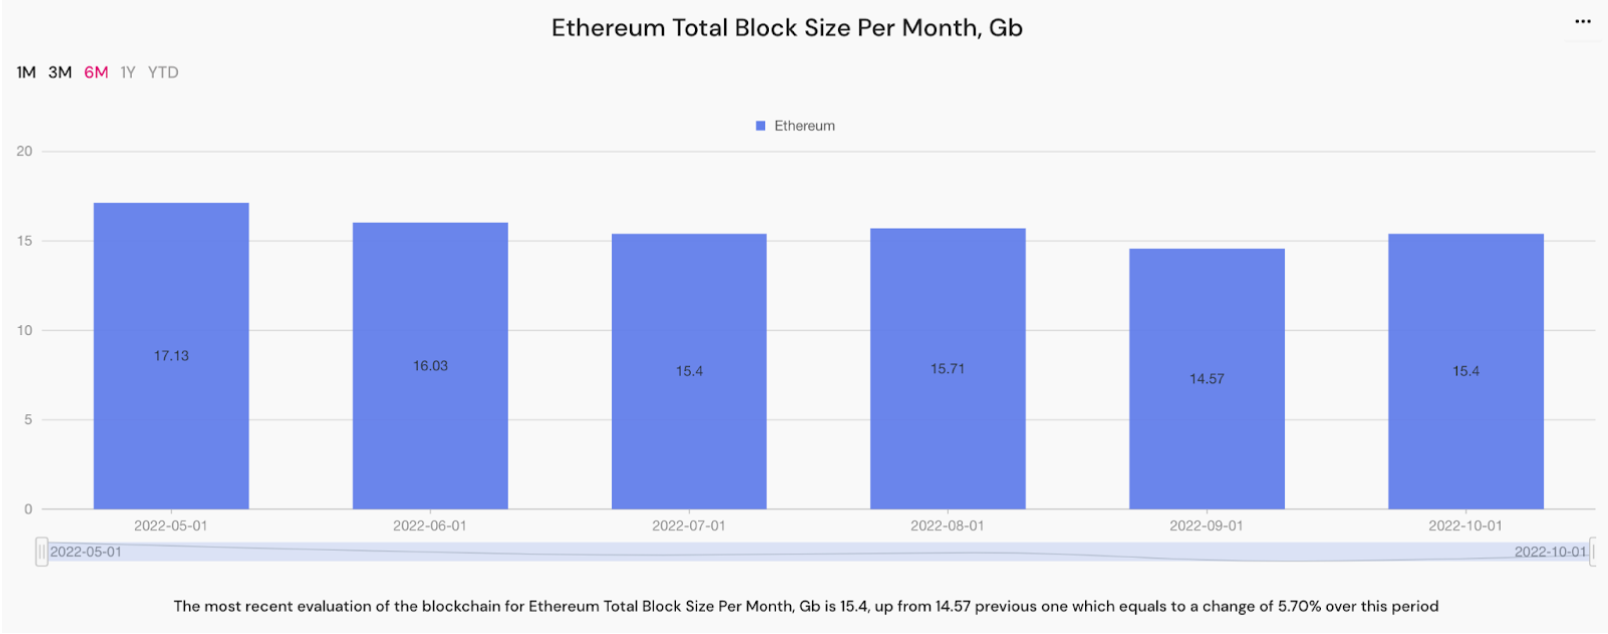
Ethereum total block size per month
Ethereum gas prices statistics
- Average Ethereum gas price increased by 31.3% in October because of the chain activity.
In October, the average Ethereum gas price was 22.5 gwei. In September, it was 17.1 gwei. The gas price increased by 31.3%.
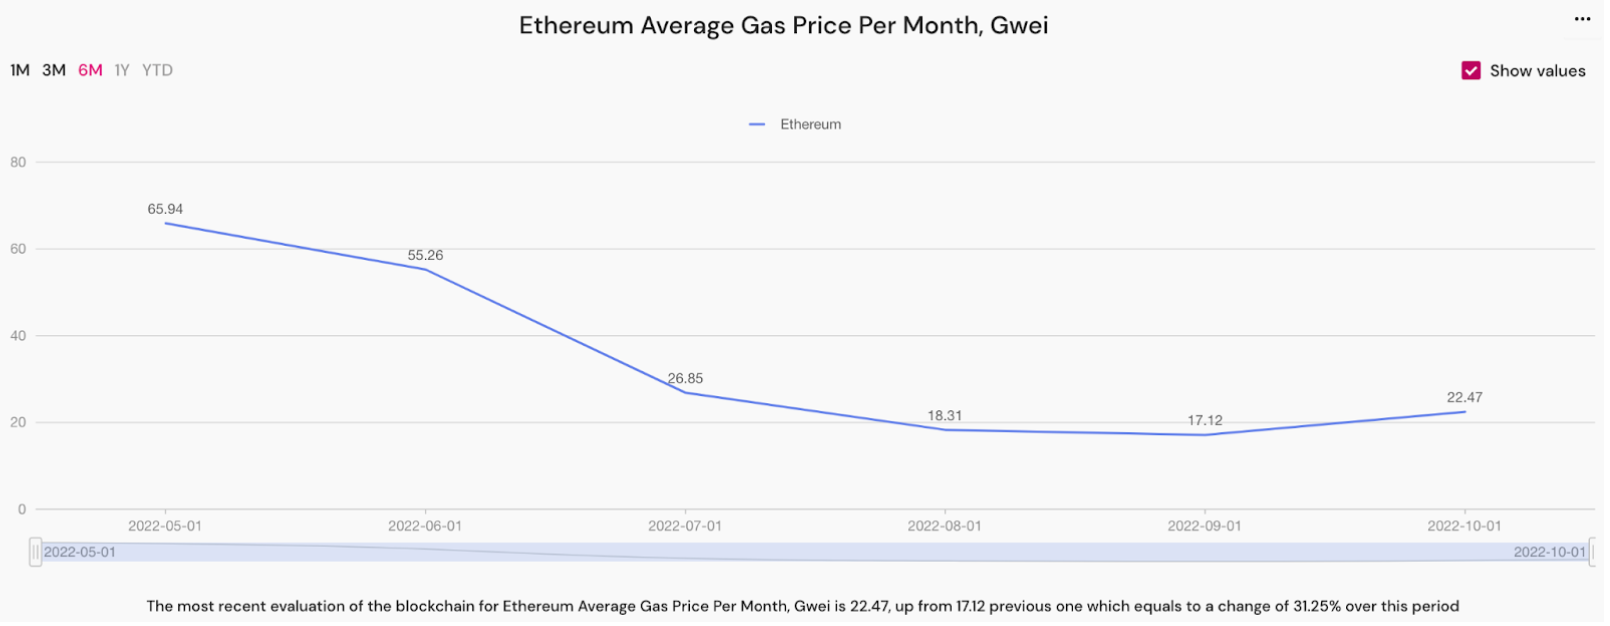
ETH average gas price per month
In October, the price increased in spite of the merge. It means that the chain activity increased significantly.
The minimum value of the gas price in October was recorded on the second and was 8.5 gwei. This is the lowest recorded price of gas in the last seven months.
The maximum value was recorded on the 10th and was 37.6 gwei.
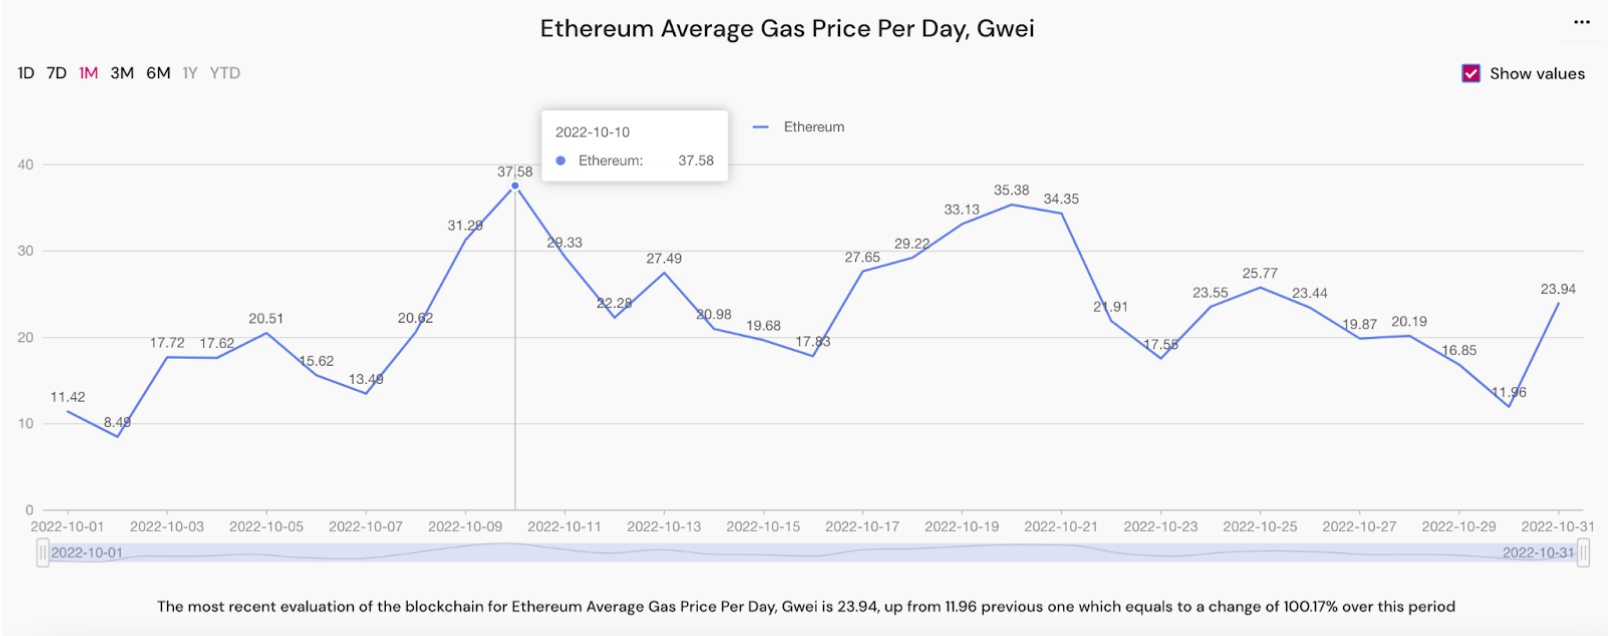
Ethereum average gas price per day
Ethereum new smart contracts statistics
- The number of ERC-20 tokens created in the Ethereum network in October increased by 33.4%.
The number of ERC-20 tokens created on the Ethereum network in October was 14,295. In September, this figure was 10,714. It increased by 33.4%.
Ethereum active addresses statistics
- In October, the average number of unique active crypto wallets per day as well as the average number of daily active smart contracts decreased by 7.4% and 4.6%, respectively.
In September, the average number of unique active crypto wallets per day in the Ethereum blockchain was 465,072. In October, this figure was 430,783, so it is a decrease of 7.4%.
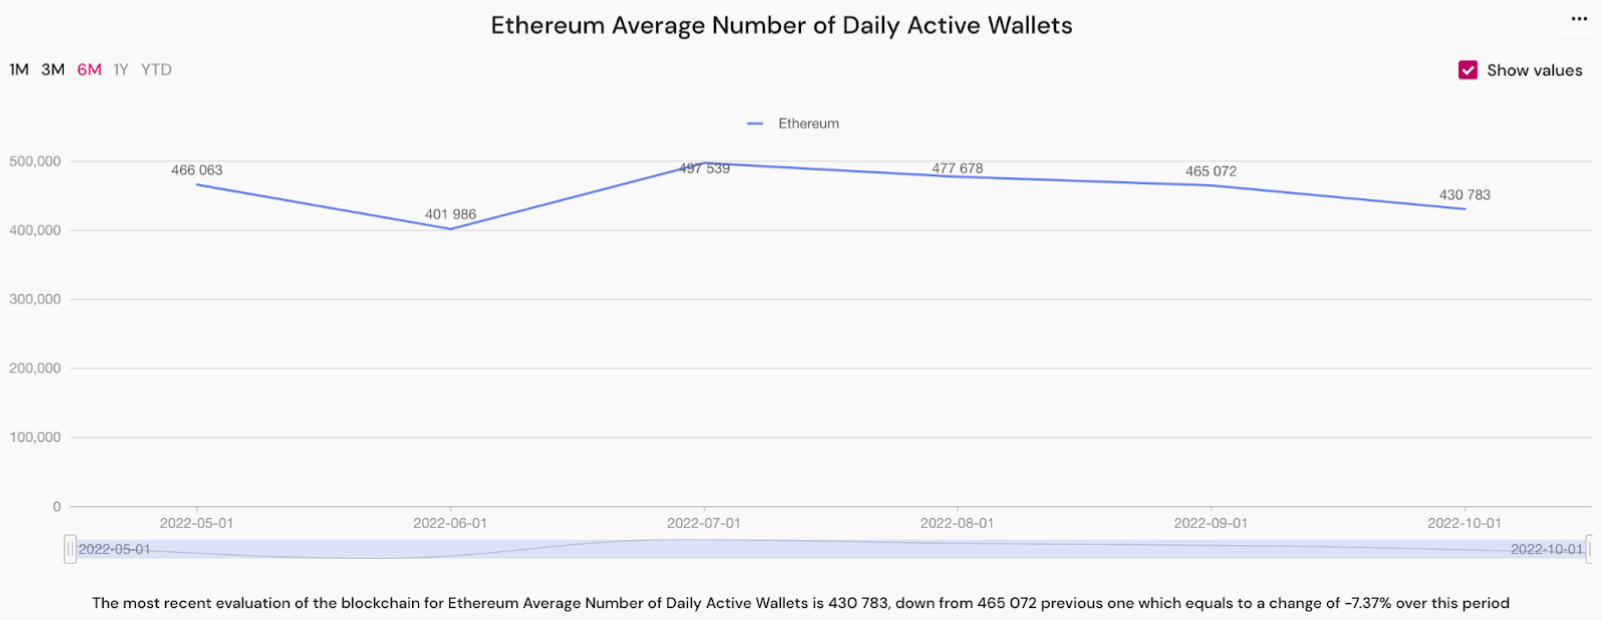
Ethereum average number of daily active wallets
A similar situation is observed with the average number of daily active smart contracts. This value in September was 25,294. It decreased by 4.6% and was 24,123 in October.
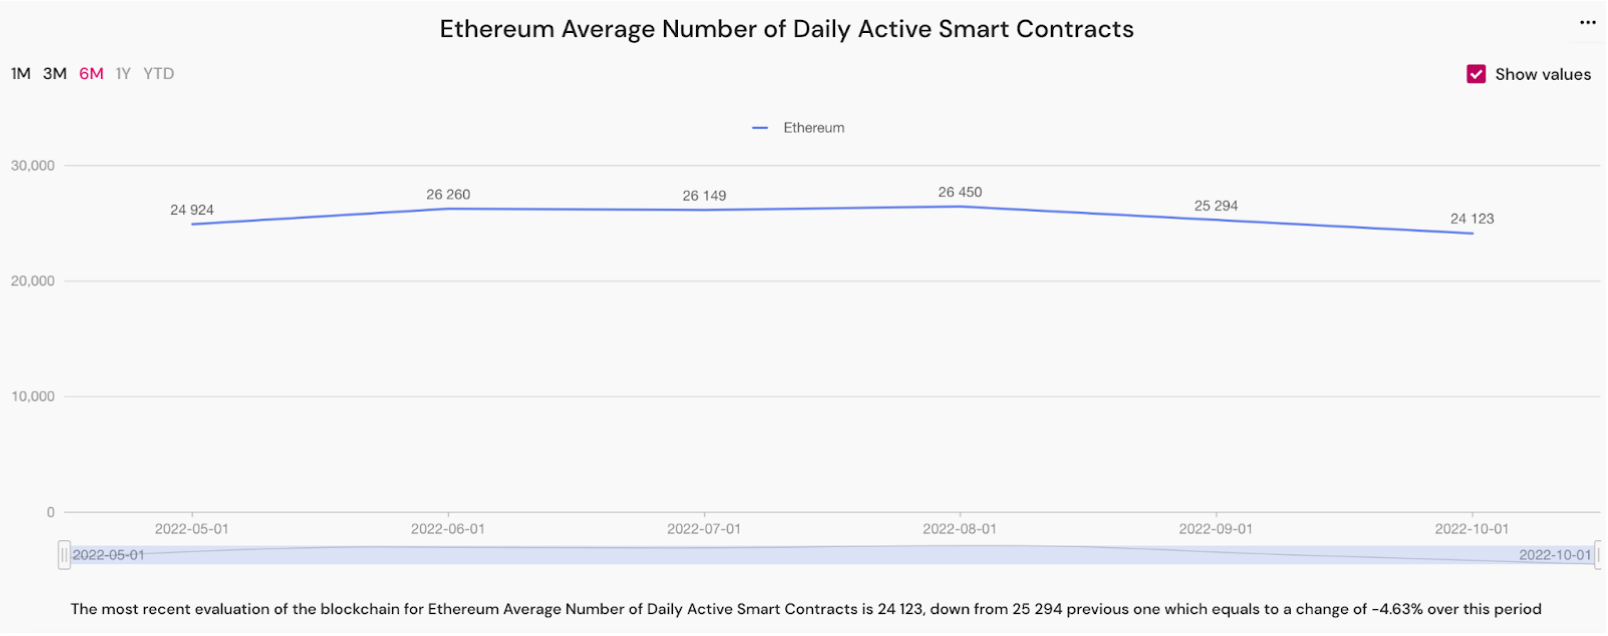
Ethereum average number of daily active smart contracts
Data-driven conclusions
The October data continues to reflect the impact of the Ethereum blockchain transition to a proof-of-stake system. Thus, the number of blocks per day has increased, as well as their size.
At the same time, the activity of the network as a whole increased, as the price of gas increased despite the fundamental decline in the price of gas after the merge.
The number of new smart contracts on the Ethereum network has also grown this is a good sign. However, the number of active wallets and smart contracts continues to decline.
This means that only the most persistent remain on the market, and the activity of specific users is growing day by day, which can positively affect the market, which is simply tired of looking down.
Max Nekoz is the data analyst and senior innovation manager of the real-time DeFi explorer AnalytEx by HashEx. Max is a crypto enthusiast and has been analyzing blockchains for over five years. For more than two years, he has been working at HashEx Blockchain Security and is actively developing the company’s products.
Follow Us on Twitter Facebook Telegram

Disclaimer: Opinions expressed at The Daily Hodl are not investment advice. Investors should do their due diligence before making any high-risk investments in Bitcoin, cryptocurrency or digital assets. Please be advised that your transfers and trades are at your own risk, and any loses you may incur are your responsibility. The Daily Hodl does not recommend the buying or selling of any cryptocurrencies or digital assets, nor is The Daily Hodl an investment advisor. Please note that The Daily Hodl participates in affiliate marketing.
Featured Image: Shutterstock/Mr Dasenna


