HodlX Guest Post Submit Your Post
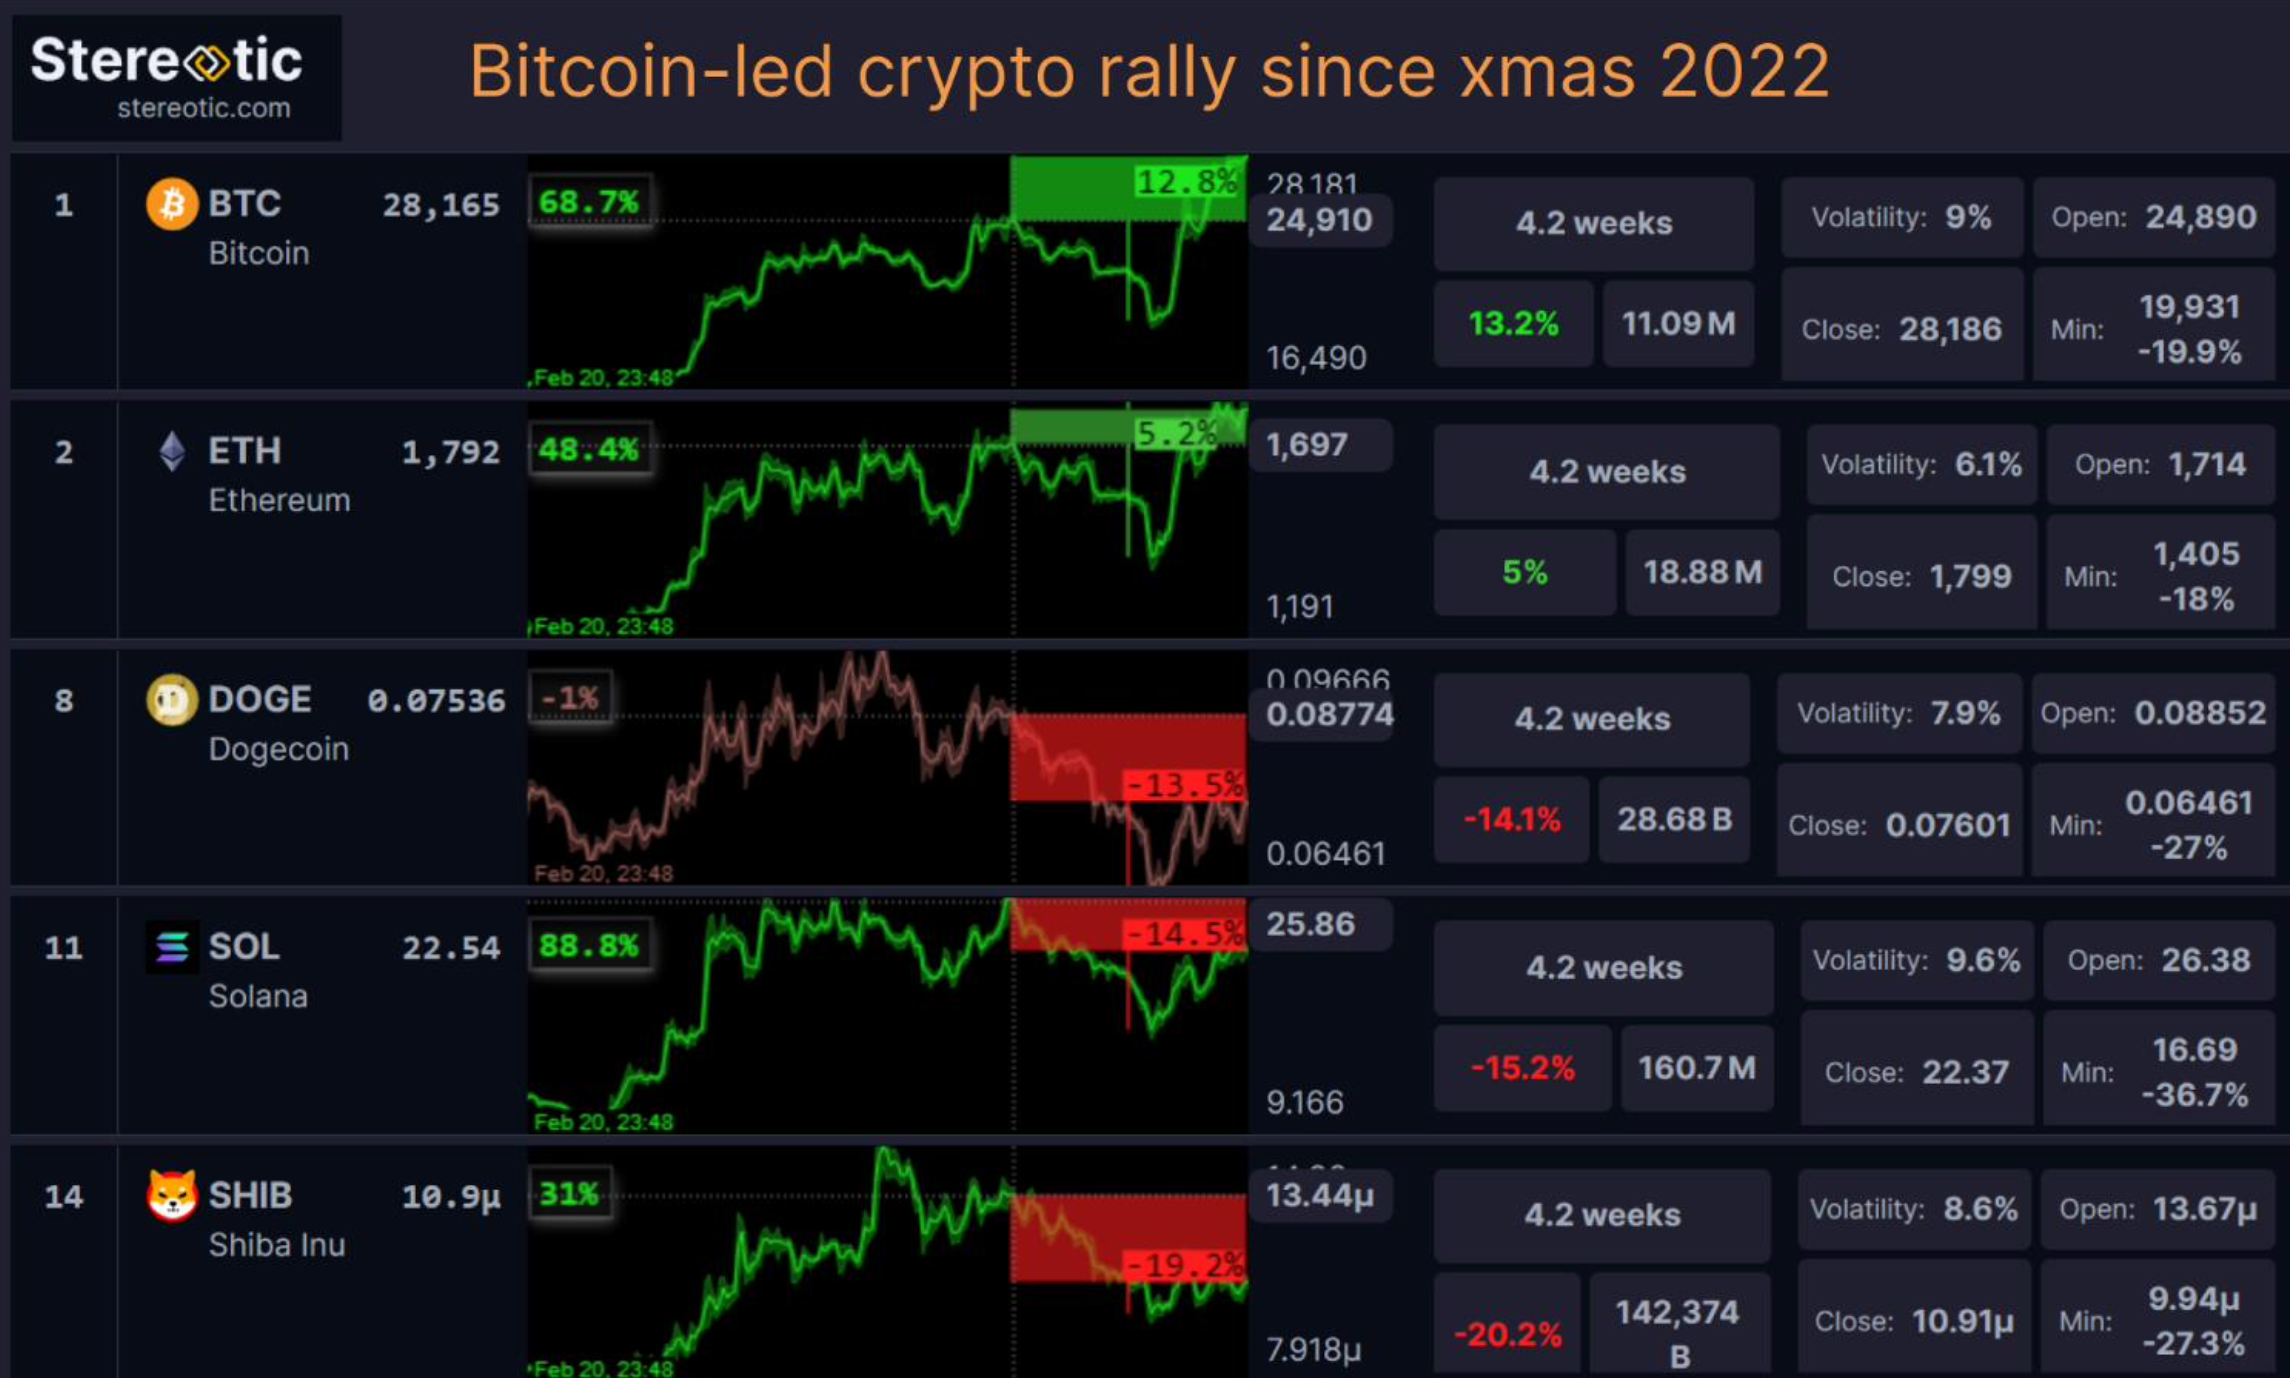
We are witnessing an astonishing rally in the cryptocurrency market, with the price of BTC increasing more than 68% during the last 90 days.

The rally is much older and much greater than the recent bull run on the banking crisis. Only 13% can be attributed to the crisis as of March 22, 2023.
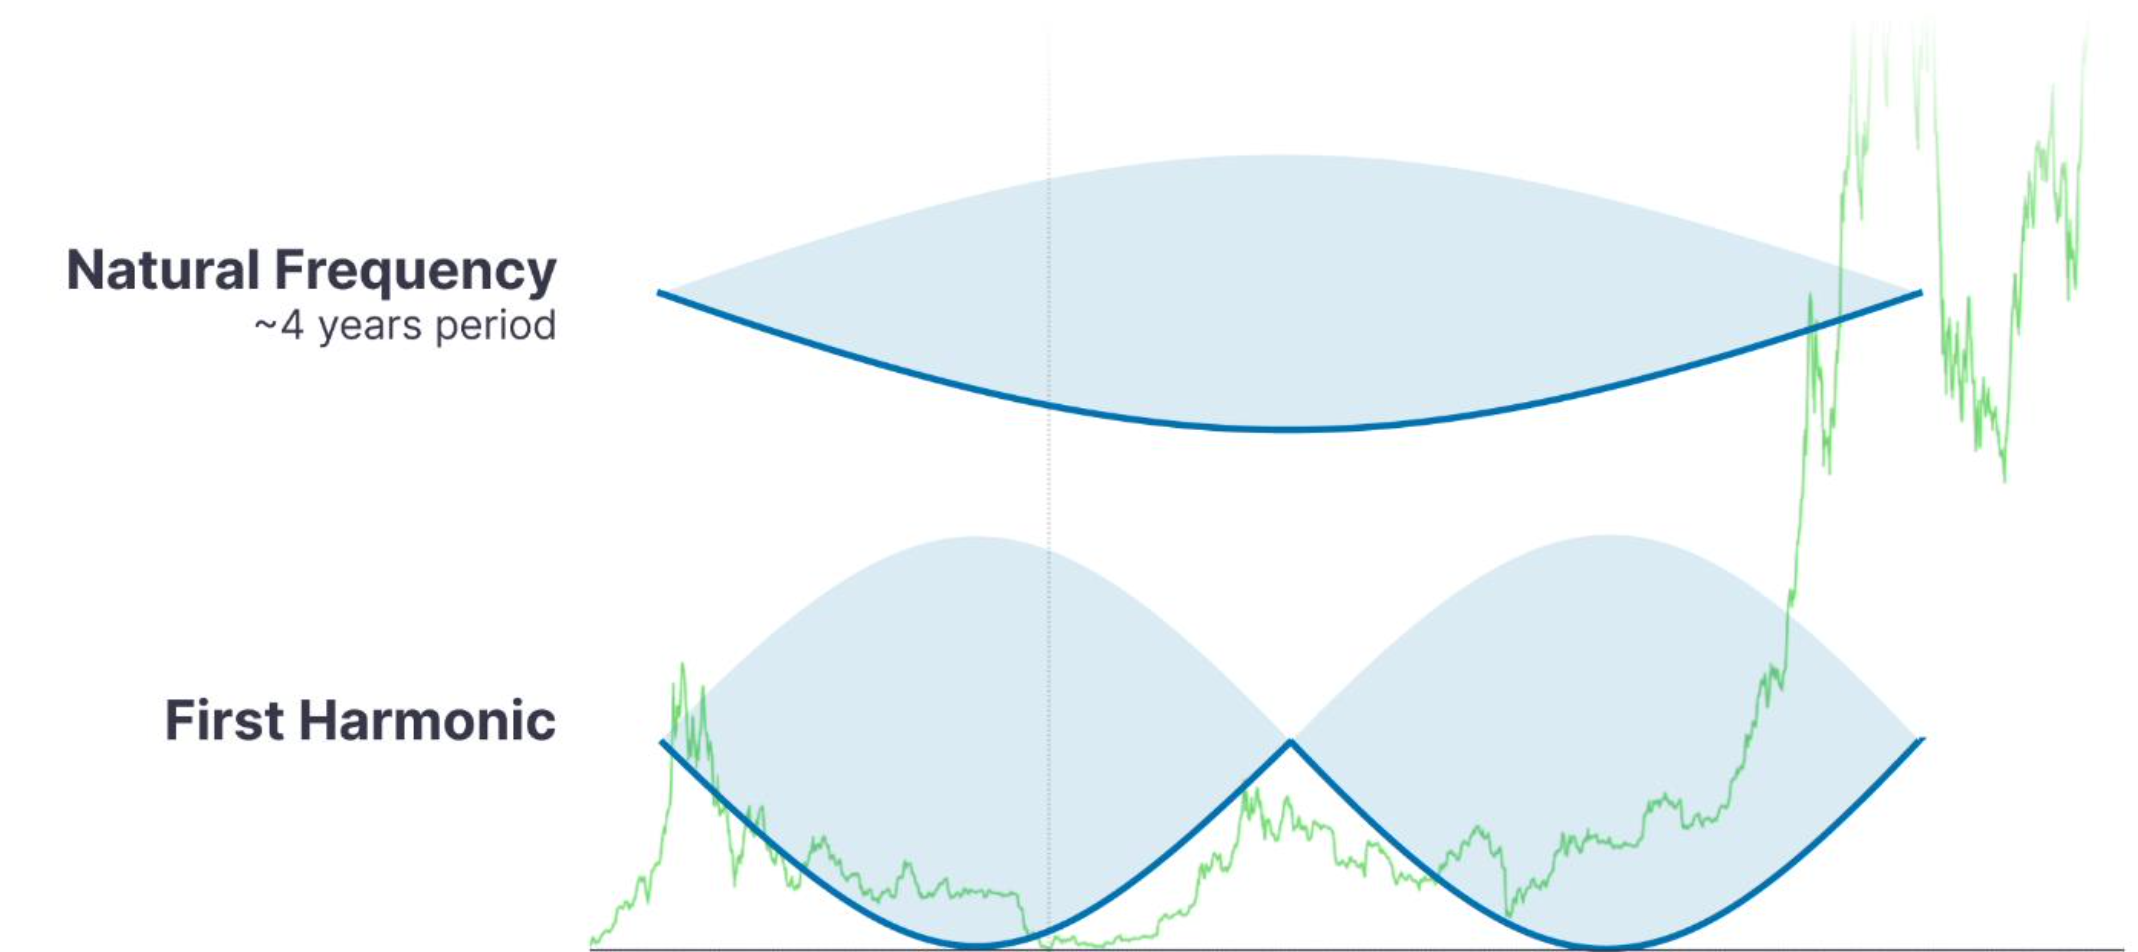
Our new theory suggests that the recurring shock of the four-year Bitcoin halving sudden event when the inflation of Bitcoin halves triggers not just great bull runs but also a wave-like resonance in the price of Bitcoin akin to the vibrations of a string being plucked.
This physical analogy helps us to understand the ongoing bull run better.
It is well-known that a plucked string has a natural frequency at which it vibrates, determined by its physical properties. However, there are also overtones that appear in the string’s vibration, known as harmonics.
The first harmonic, for instance, is an intermediate, smaller wave that emerges during half of the plucking cycle at the bottom of a bear market.

Bitcoin price exhibits harmonic waves after plucked by the four-year recurring halvings
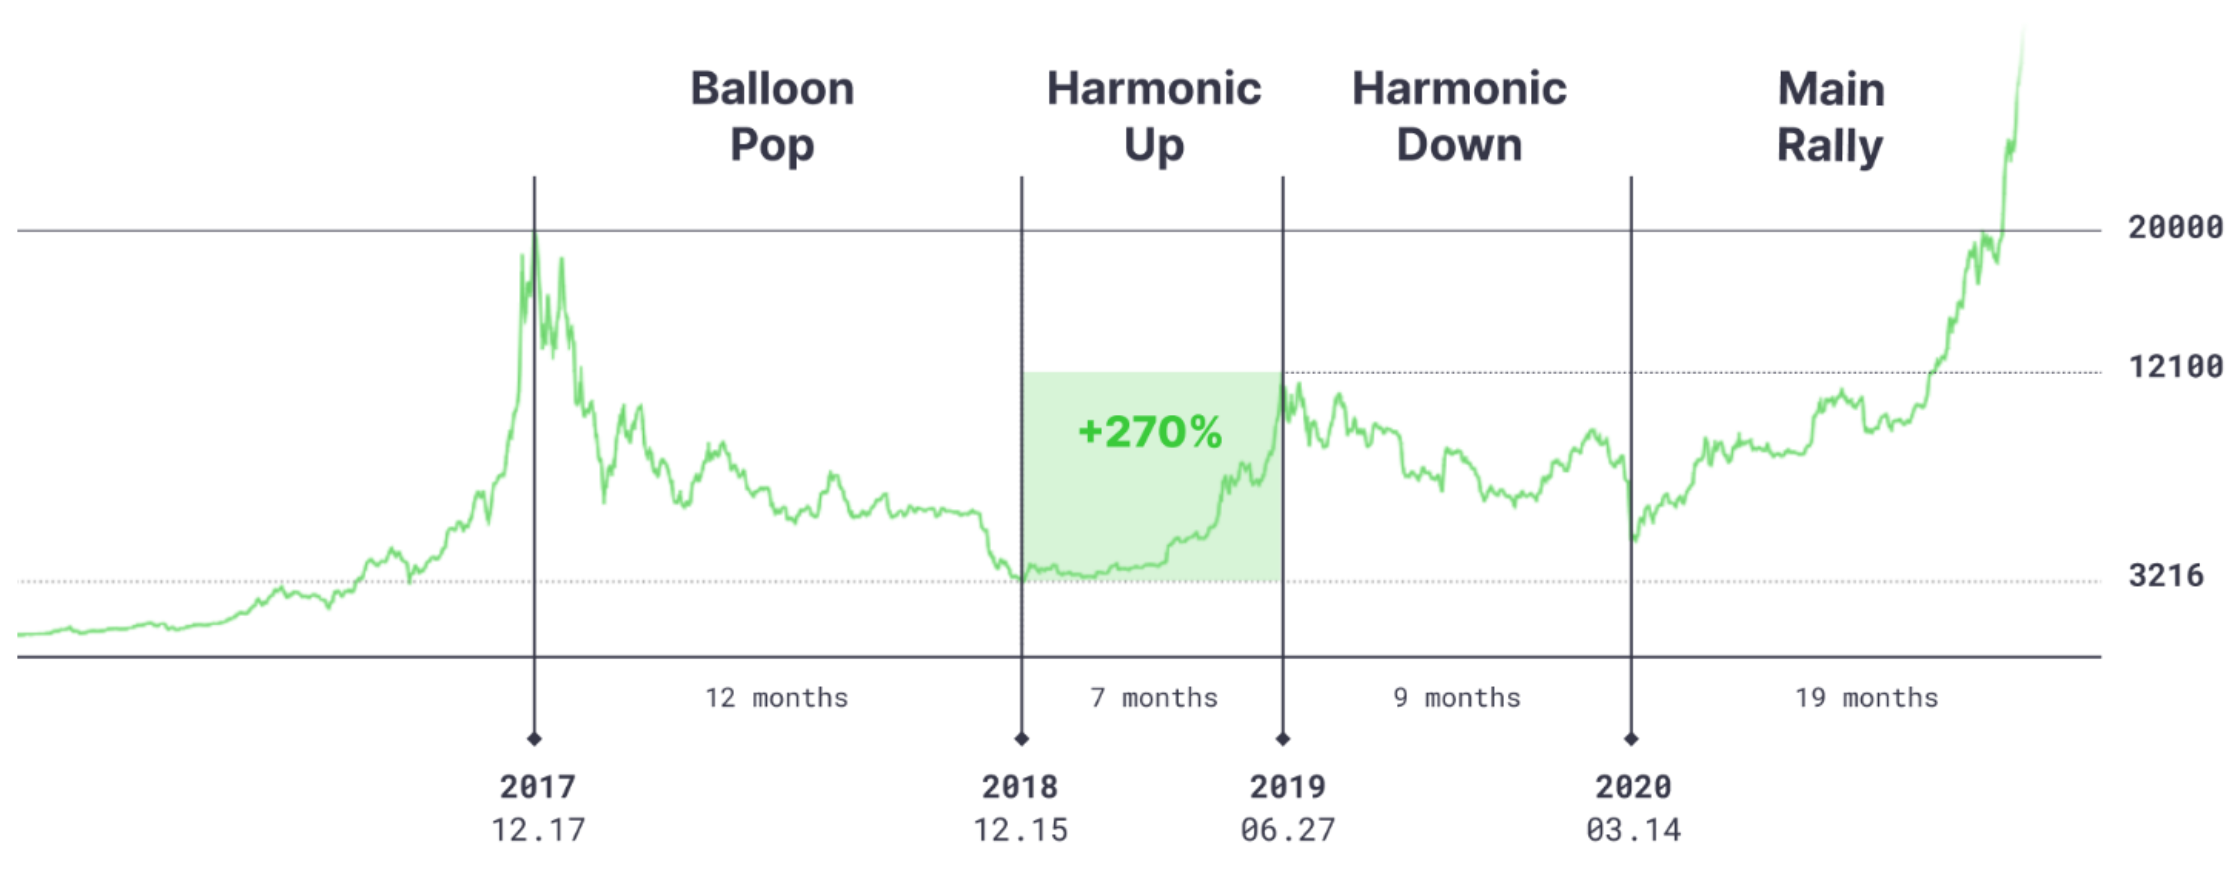
This phenomenon was clearly observed during the bear market of 2018–2019. After hitting its lowest point in December 2018, Bitcoin rose more than 270% in just seven months to reach $12,100.
Then the price slowly went back down again, before the halving on May 11, 2020, initiated the new bull run.
We can divide the four-year cycle into four harmonic stages.

Harmonic stages of a Bitcoin cycle
The first stage is the ‘balloon pop,’ which lasts from the ATH (all-time high) to the cycle’s low point. The second stage is the rising trend of the ‘first harmonic,’ and the third one is the downtrend of the harmonic, followed by the next ‘main rally’ that ends the cycle.
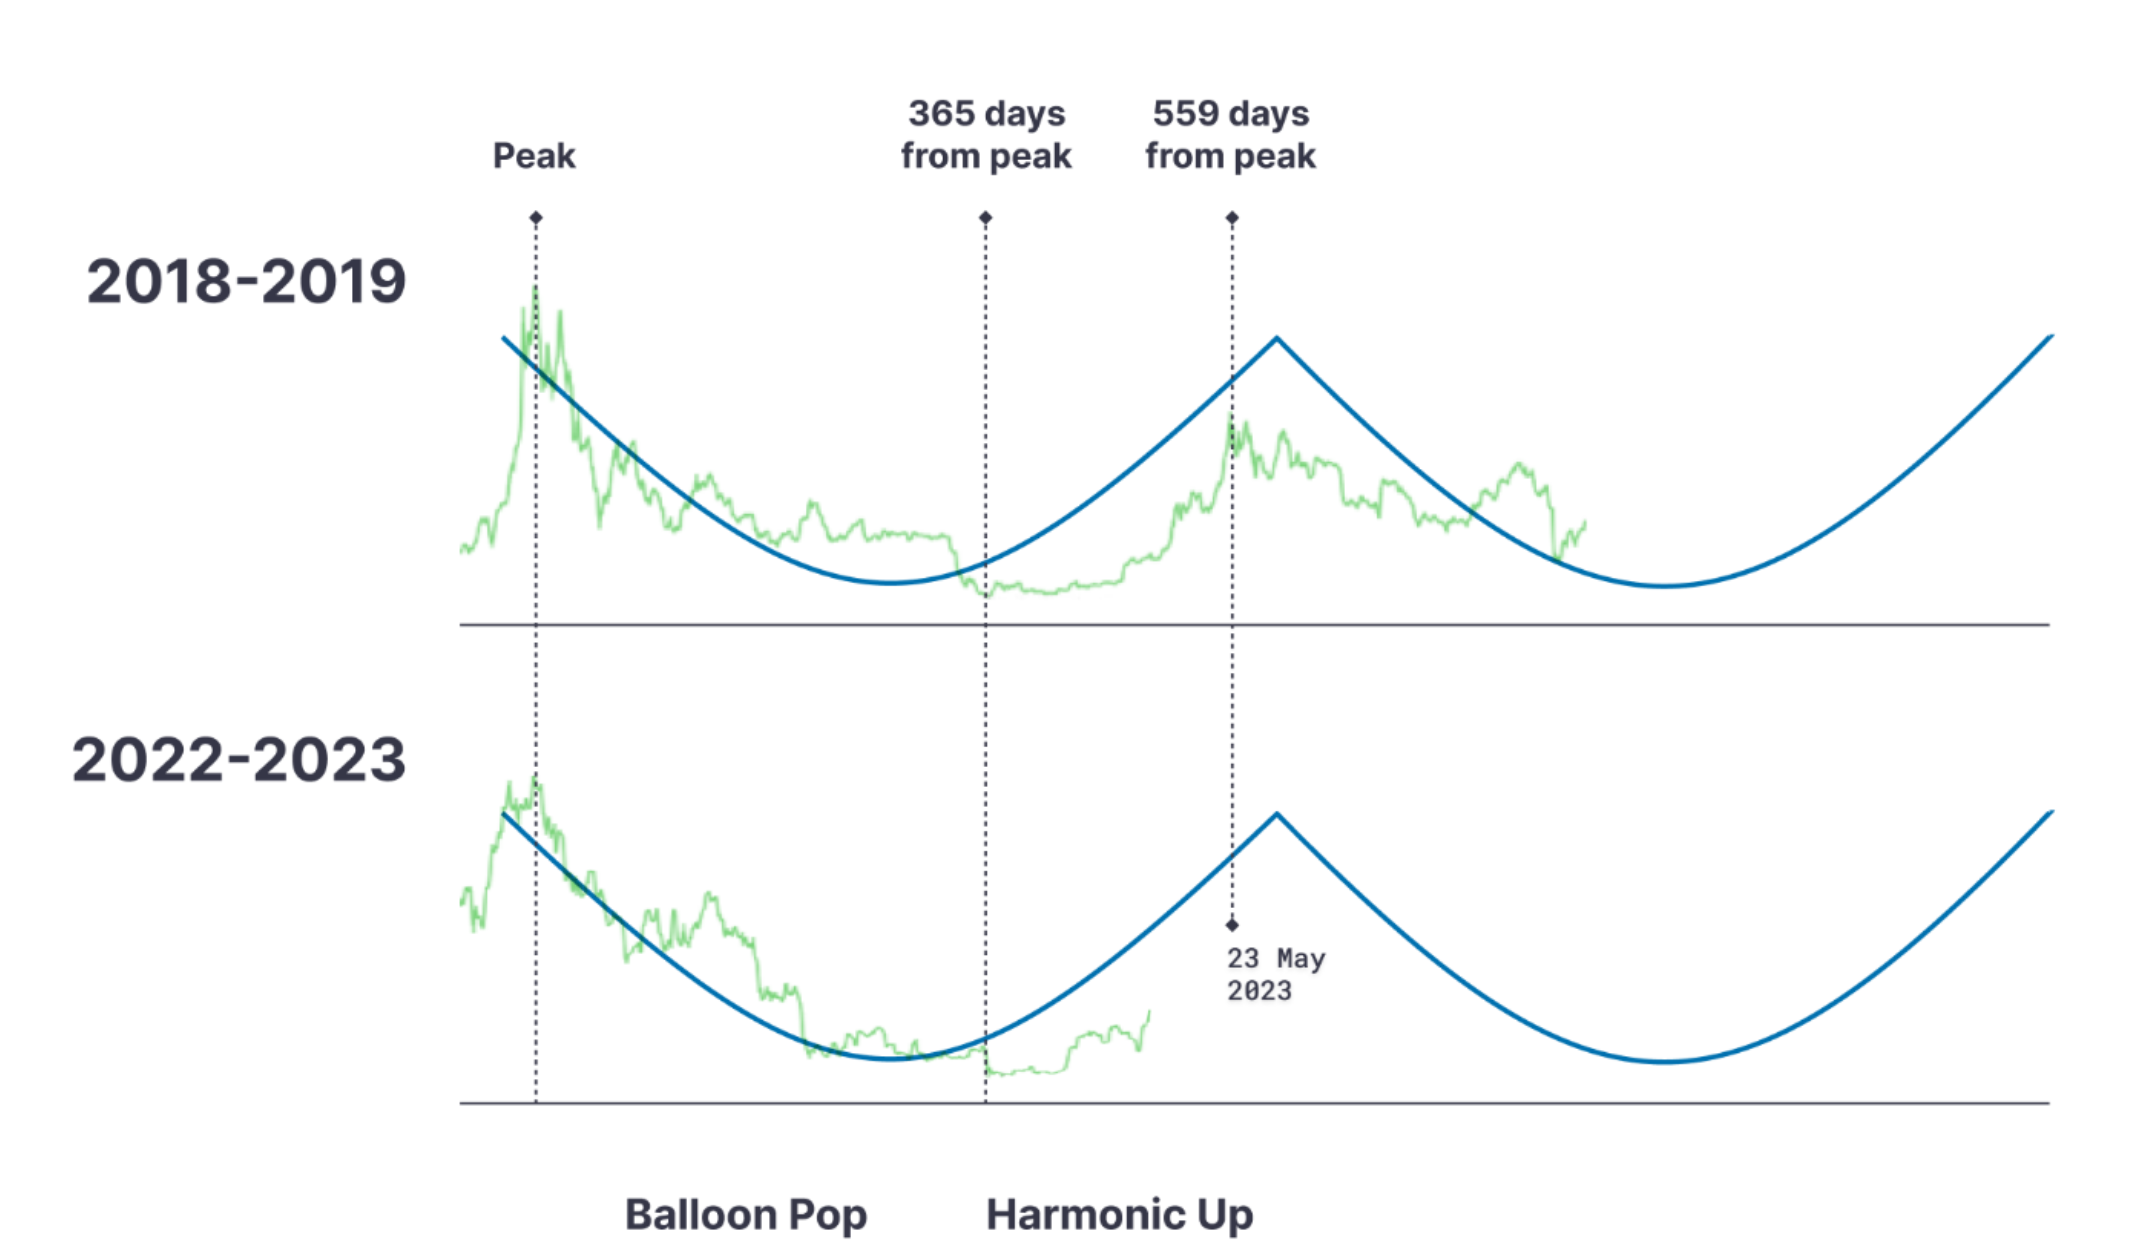
In the current bear market, we can once again observe the first harmonic in action.

On November 22, 2022, Bitcoin fell to 15,800 then in less than four months, it rose 77% to 26,000. But this is still only 40% of its ATH, so there is more room upward.
The most exciting question is ow high this harmonic wave can rise?
Last time it went up to 60% of the at-the-time ATH, which yields the prediction of $41,000 for the current harmonic. But we are living in a different world today, and we are in the middle of a financial crisis, so the harmonic peak may be very different.
Can it go to 1,000,000? Hopefully not now, as the world is not prepared.
The crucial question is not the height of the rally but rather the timing hen can we expect the harmonic peak?
The simple calculation is as follows. The 2019 harmonic peak was 559 days in that bear market. Assuming the exact same timing for the current bear market yields May 23, 2023, for the harmonic peak date.
Since we have already passed the balloon pop and entered the uptrend of the first harmonic in the current cycle, we can add more detail to the prediction by comparing our progress stage by stage.
As the bottom of the ‘pop’ was a month later than last time, we may think that the harmonic up will also end later, going well into June.
Of course, interpreting the data is always subjective, and another analyst may have different insights. Yogi Berra was right in saying, “It’s tough to make predictions especially about the future.”
Krisztián Schäffer is the founder of Stereotic, a new investing platform looking for angels. He holds Bitcoin and other crypto assets in his portfolio.
Follow Us on Twitter Facebook Telegram

Disclaimer: Opinions expressed at The Daily Hodl are not investment advice. Investors should do their due diligence before making any high-risk investments in Bitcoin, cryptocurrency or digital assets. Please be advised that your transfers and trades are at your own risk, and any loses you may incur are your responsibility. The Daily Hodl does not recommend the buying or selling of any cryptocurrencies or digital assets, nor is The Daily Hodl an investment advisor. Please note that The Daily Hodl participates in affiliate marketing.
Featured Image: Shutterstock/HitToon/GB_Art


