HodlX Guest Post Submit Your Post
Hello, fellow crypto enthusiasts! Most cryptos saw a nice little pop yesterday with Bitcoin getting back over the $6000 level going from around $5900 to over $6500. I am very skeptical of this bounce though, I do not believe that this is the beginning of a long-term recovery, it most likely is just the start of a short-term recovery. My personal belief is that it is going to take some time before we see a real long-term recovery, which I believe will come after a period of consolidation which could last several months.
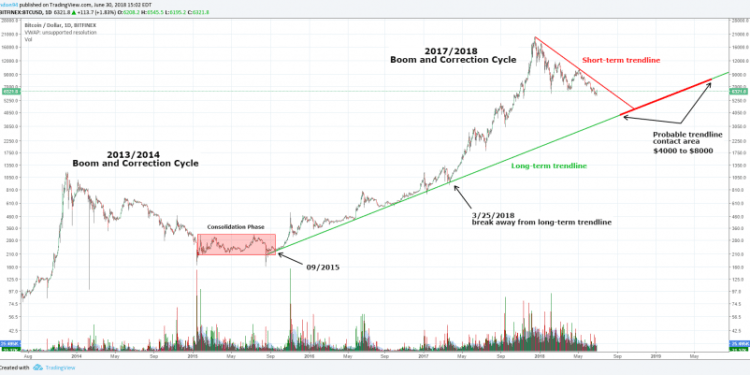
See chart above.
So, for today’s chart, I am looking at a long-term view of the price of Bitcoin using the daily time frame (Bitfinex price). Because I am looking at a very long-term view I am using a logarithmic scale, another reason I am using a log scale chart is because of the huge increase in the price of Bitcoin over this period. Okay, so looking at the chart which starts around July of 2013 you can see that I have drawn in a long-term trend line which begins around the beginning of September 2015 and has periodic price touches up until the end of March 2017. You can see that I have also extended the trend line up beyond today’s price level. Notice how starting around the end of March last year the price of Bitcoin broke away from the trend line and accelerated higher culminating in the hysteria of last fall and the eventual peak at just under $20,000 in December. Since that peak on December 17th, the price of Bitcoin has been stuck in a correction phase which is still playing out today.
Ultimately, the price of Bitcoin will find a bottom, which as of today is unknown. It is possible that the price of Bitcoin is close to a bottom now or the bottom could be much lower. Either way, my belief is that eventually, we are most likely going to return to the long-term trend line before starting to move higher in a sustained long-term recovery. The return to the trend line, in my opinion, could happen in a couple of different ways. One way would be if the price of Bitcoin somewhat follows the red short-term trend line lower until eventually finding a bottom and making contact with the long-term trend line, in the $4000 to $5000 area. Another way I believe is possible is that if the price is already at or near a bottom and moves sideways in a consolidation phase from here until it eventually makes contact with the long-term trend line somewhere between $5000 and $8000. Still another scenario would be that the price of Bitcoin crashes from here in a very steep decline down to the trend line between $3000 and $4000, I think this scenario is very unlikely though so I would expect one of the other two to occur.
I should also say that I am not blind to the fact that it is possible that none of these scenarios will come true. Who knows, the price of Bitcoin in the near future could take off higher and never come close to my long-term trend line. I try to keep an open mind and consider all of the possibilities, I also want to say that I personally don’t care which scenario plays out because long-term I remain very bullish on cryptocurrencies. I believe that in a couple of years from now they will be at a much higher price than they are at today, the only question I see is in the short-term how things play out and transition into the next bull market.
I really appreciate you taking the time to view my chart and analysis!
Until the next one, take care!
BigskyCrypto
Questions or comments? Email me at info@bigskycrypto.com
Also if you get time check out the new BigskyCrypto store: https://bigskycrypto.store
It is still a work in process so check back as I will be adding a lot more merchandise.
I will be using any proceeds from the store to offset the costs of materials and advertising related to my blogging, my website, my Patreon page, and my steemit page.
Follow Us on Twitter Facebook Telegram


